% T = I
Io
If the absorbability if the sample is unknown, the molarity (concentration) of the unknown may be obtained with the aid of Lamberts Law and by using a calibration curve.
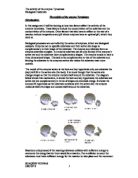
To analyse samples of solutions such as cyt.C, single beam spectrophotomery is used. This utilises a continuous source of light. Instruments with a continuous light source have a dispersing element and a ‘slit’, which selects a single wavelength by isolation. This is carried out before the beam of light is passed through the absorption cell (cuvette). The absorbance of light varies as the wavelength of light changes.
Any light that is not absorbed is transmitted to a detector; this measures the amount of light at the particular wavelength that is passing through the sample. Another function of the detector is to convert the light energy into chemical energy, which is displayed on a digital meter.
The diagram below shows the main components of the spectrophotometer. The role of the monochromator is used to turn polychromatic light into monochromatic light.
The concentration of cytochrome-C was determined using the above equipment.
Cytochrome-C is a protein important in creating cellular energy and is obtained from the cell mitochondria. Cytochrome.C is usually located in the space between the inner and outer membranes of the mitochondria. There it assists in the production of ATP, by taking place in the electron transport chain. It is usually released from the mitochondria on exposure of stimuli to cells or upon damage to the cell. If this occurs cyt.C leaks into the main body of the cell. Moreover, if the cell is damaged then it is released into the tissue surrounding the cell. The release of cyt.C eventually leads to cell death-apoptosis.
Two forms of cyt.C proteins are found in the respiratory chain: cyt.C reductase and cyt.C oxidase, both of which are enzymes. They take up electrons and attach them to oxygen molecules using several metal ions.
Aim
Become familiar with using the spectrophotometer, and determine the concentration of cyt.c by comparing light absorption with the light absorption of a standard 0,1mg/ml solution.
Method
Refer to schedule.
Results
Table 1
The first set of results obtained was done to determine wavelength of the peak absorbance for 0.1mg/ml of cytochrome.c solution.
The table above shows that the peak absorbance for cytochrome .c was reached at a wavelength of 410nm. The general trend within the results displayed was that the absorbance increased with a higher wavelength up to a certain wavelength and then the absorbance started to fall (values were decreasing). This trend was plotted in a graph; refer to the absorbance spectra graph .
Table 2:
Shows how the serial dilutions of the stock 0.1mg/ml were made using a 5ml pipette.
The stock solution is the concentration of the solution being diluted.
The working solution is the diluted solution, which is ready for use.
The dilution factor is a number that describes the strength of the dilution. It is equal to the volume of stock solution used (V1), divided by the total working volume (V2). So (V2) = (V1) + volume of dilutent used.
The equation for the dilution factor can be expressed as V1 = V2.
Table 3
The value 0.003 was determined by filling the cuvette with water in order to determine the absorbance. This was carried out to see if the two cuvettes differed appreciatebly in amount of light transmitted.
The above results were also graphed (refer to graph ). The graph showed that the absorbance of cytochrome c was directly proportional to the concentration of cyt.c as shown by the straight line on the graph.
All of the above absorbance for each of the dilutions and the undiluted stock were measured at the wavelength of maximum absorbance (410nm). See results table 1. above to show how the peak absorbance was determined…….)
The absorption that was closest to the %T value (0.463) of the sample which was recorded after the meter had been set to read exactly 100% when a cuvette containing 3ml of de-ionised water had been placed in the chamber was 0.464 recorded at a concentration of 0.06mg/ml. This suggested that the instrument reading was accurate as the difference between both values was 0.001 absorbance units.
Discussion
The graph drawn for absorbance against concentration of cyt.c was a straight line with an intercept at zero, a plot of results such as this is called a calibration curve (the same as a y=mx+c curve). The linearity of the calibration curve also confirms that the solution under study did comply with Beer's law.
Beer lamberts law (Esq. 4.) defines that there is a simple linear relationship between spectrum (absorbance) and composition of a sample:
Eq. 4. A = abc
Where:
A = absorbance
b = path length
a = specific absorbance
c = concentration
(a and b are usually constants)
It states when a sample is placed in a beam of light in the spectrophotometer, there is a direct and linear relationship between the concentration of its constituents and the amount of energy it absorbs.
This means higher concentration means more light is absorbed. This trend was also displayed in the results obtained. Refer to table 3, at a concentration of 0.08mg/ml the absorbance read 0.624, and if this value was compared with the absorbance at 0.04mg/ml, which was 0.286, it suggests that Beer lamberts law was followed as stated above. However, this was only true if there was an equal path length of the cuvette and only if, the beam of radiation passes through a homogeneous solution.
Measurement and accurate predictions of quantities of the constituents present in a particular solution such as cyt.c was made possible by the use of a calibration curve. This was achieved by interpolation, which was when the absorbance reading from the horizontal axis was traced at 0.464 units until it intersects at the best-fit line. Then it was dropped vertically to find the appropriate concentration, which was approximately 0.06 mg/ml.
On comparing results with other group’s results, it was discovered that some groups were not able to produce a calibration curve that followed Beer’s law. This may have been due a various reasons such as:
*path length may have not been constant ( square cuvette may not have been used)
*scattering of the beam of light due to particles being in the heterogeneous phase
*fluorescent sample
*too high a concentration used,
*there may have been some form of damage to the light source, it may have been broken.
* Other causes may have been due to carrying out of incorrect procedures, such as some students may have pipetted directly from the stock solution
*students may have washed out the pipette with distilled water instead of using the stock solution.
*failure to wipe the surface of the cuvette clean of fingerprints before making an absorbance measurement
*not ensuring that all solutions measured were free of bubbles.
*Not making sure that the cuvette was dry before usage and holding the cuvette from the sides instead of holding only the top edge of the ribbed sides.
All of the factors outlined above may have been a cause of the irregularity of the calibration curve.
An absorbance spectrum is the relative absorbance value of the solution (cyt.C) at different wavelengths within the visible range. The absorbance spectrum plotted correlating to the results obtained is shown in graph 1. The reason why the absorbance was measured at a wavelength that corresponded to maximum absorbance reading was because the greatest change in the concentration of the absorbing species is seen at the maximum wavelength and therefore, the capability of the spectrophotometer to detect small changes in the concentration of the absorbing species maximises. Not only this but as explained above, after the peak absorption had been reached at the maximum wavelength possible, the changes in wavelength after these values are very small. Beer’s law will no longer be followed.