Method and materials:
Before starting the practical you will need to be familiar to use pipettes and the spectrophotometer. The following apparatus would be required:
-
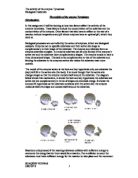
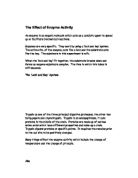
You will need three different micropipettes, which deliver fixed volumes ranging from 1-20ul, 20-200ul and a 100-1000 ul. These volumes are adjusted by moving the volume control wheel resulting in specific volumes being displayed digitally on the handle. Also note that the pipette of different volume ranges are colour-coded as are their associated disposable tips, the blue one holds volumes ≤ 1000ul and the yellow ones hold volumes of ≤ 200ul. Therefore appropriate tips would have to be used with appropriate pipettes.
- You will also need a spectrophotometer to measure the changes in absorbance after 3 minutes and 5 minutes. This allows me to calculate the optical density. The formation of the chromophore is measured at 475nm. Therefore the spectrophotometer would have to be set at this and to start calibration the zero button would have to be pressed.
- You will also need a stirrer to stir the solutions together for the reaction to start taking place before placing the cuvette in the spectrophotometer.
- You will need 5 cuvettes for this part of the investigation each one is used for different concentrations as shown below in table 1.
- You will also need a stopwatch to record you’re results after 3 minutes and 5 minutes.
The following reagents would be used:
- L tyrosine (substrate (0.01M)
- Tyrosinase (enzyme) (1mg/ml)
- Phosphate buffer (Ph 7.0) (0.1M)
The phosphate buffer was chosen because at pH 7.0 because this pH is the optimum for tyrosinase activity.
Substrate concentrations used (Table 1)
N.B: The volumes in the brackets indicate that the volume was converted to micromoles as this measurement was used. This was done by taking the substrate concentration (20ml) and dividing it by the total volume used (900ml) and the X this by the concentration of the substrate (0.01 M). I then converted this answer to micro- moles (um) by X the number to the power of –6. The numbers 1-5 indicate the different concentrations used in the five cuvettes labelled 1-5. The actual concentrations of the enzymes were worked out as follows:
1: 20 / 900 x 0.01 x ¯ 6 = 0.000000022 um (2.2x 10¯ 10)
2: 40 / 900 x 0.01 x ¯ 6 = 0.000000044 um (4.4x 10¯ 10)
3: 60 / 900 x 0.01 x ¯ 6 = 0.000000066 um (6.6x 10¯ 10)
4: 80 / 900 x 0.01 x ¯ 6 = 0.000000088 um (8.8x 10¯ 10)
5: 100/ 900 x 0.01 x ¯ 6 = 0.000000111 um (1.11x 10¯ 9)
Procedure: (Substrate concentration):
First of all you need to make the five solutions as labelled in table 1, using the appropriate pipettes for different volumes to does this. We will start with the number 1 and carry on with the same procedures as outlined below for numbers2, 3, 4 and 5
- First of all you would need to select the 20-200ul pipette and set the pipette at 20 ul by moving the volume control button.
- Depress the push button displacing the measured volume of air; releasing it withdraws up the volume in the plastic tip.
- You would then transfer the solution in a clean cuvette.
- Depressing a second button at the top of the pipette allows the deposable tip to be automatically ejected after use, therefore reducing the risk of contact with potentially hazardous materials.
- You would then be required to select a 100-1000ul pipette and set it at 860ul. You take up 860ul of phosphate buffer and displace this solution in the same cuvette.
- You then take a 1-20 ul pipette and set it at 20ul. Take up 20ul of tyrosinase enzyme and place in the same cuvette. Soon as you do these give the cuvette a stir using the stirrer and place it in the spectrophotometer as mentioned above.
The enzyme is placed at the end to the cuvette because it starts of the reaction at this point. Make sure that you have set the spectrophotometer at 475nm and start the calibration by pressing the zero button. You would then be required to record the changes in absorbance after 5 minutes and 7 minutes. You would record you’re results as in table 2. You are then required to carry out the same procedures using appropriate pipettes to maintain accuracy and precision using the concentrations in table 1 for cuvette numbers 2, 3 4 and 5.
Table 2: Substrate concentrations
N.B: The numbers 1-5 indicate the cuvettes with different concentrations of the substrate L- tyrosinine (these were calculated and are shown in the results table 5). The change in optical density is determined at each substrate concentration by subtracting the optical density at 5 minutes minus the optical density at 3 minutes: This is shown in the equation below:
OD 5min – OD3min = OD/2min
Procedure: (Enzyme concentration):
In this part of the experiment you would be required to carry out the same procedures as in the substrate concentrations using the micropipettes and setting the spectrophotometer at 475nm, and recording you’re results after 3 minutes and 5 minutes using the changes in absorbance.
First of all you need to make the five solutions as labelled in table 3 below; using the appropriate pipettes for different volumes to does this. We will start with the number 1 and carry on with the same procedures as outlined below for numbers 3, 4 and 5.
Table 3: (Enzyme concentrations):
N.B: The volumes in the brackets indicate that the volume was converted to micromoles as this measurement was used. This was done by taking the substrate concentration (100ml) and dividing it by the total volume used (900ml) and the X this by the concentration of the enzyme (1 mg/ml). The numbers 1-5 again indicate the different concentrations used in the five cuvettes in mg/ml. The conversion of enzyme concentration to ul (micromoles) was as follows:
1: 20 / 900 x 1 = 0.022mg/ml
2: 40 / 900 x 1 = 0.044mg/ml
3: 60 / 900 x 1 = 0.066 mg/ml
4: 80 / 900 x 1 = 0.088 mg/ml
5: 100/ 900 x 1 = 0.11mg/ml
- First of all you would need to select the 20-200ul pipette and set the pipette at 100 ul by moving the volume control button.
- Depress the push button displacing the measured volume of air; releasing it withdraws up the volume in the plastic tip.
- You would then transfer the solution in a clean cuvette.
- Depressing a second button at the top of the pipette allows the deposable tip to be automatically ejected after use, therefore reducing the risk of contact with potentially hazardous materials.
- You would then be required to select a 100-1000ul pipette and set it at 790ul. You take up 790ul of phosphate buffer and displace this solution in the same cuvette.
- You then take a 1-20 ul pipette and set it at 10ul. Take up 10ul of tyrosinase enzyme and place in the same cuvette. Soon as you do this give the cuvette a stir using the stirrer and place it in the spectrophotometer as mentioned in the substrate concentration procedure.
The enzyme is placed at the end to the cuvette because it starts of the reaction at this point. Make sure that you have set the spectrophotometer at 475nm and start the calibration by pressing the zero button. You would then be required to record the changes in absorbance after 5 minutes and 7 minutes. You would record you’re results as in table 4. You are then required to carry out the same procedures using appropriate pipettes to maintain accuracy and precision using the concentrations in table 3.
Table 4: enzyme concentrations
N.B: The numbers 1-5 indicate the cuvettes with different concentrations of the substrate L- tyrosinine (these were calculated and are shown in the results table 6). The change in optical density is determined at each substrate concentration by subtracting the optical density at 5 minutes minus the optical density at 3 minutes: This is shown in the equation below:
OD 5min – OD3min = OD / mg of protein / 2min
Results:
Table 5: Substrate concentrations
Table 5, the optical density and graph A show that as you increase the substrate concentration there is a general increase in activity up until 6.6x10⁻⁸um where there a slow increase in substrate activity up until the concentration 11.1x10⁻⁸. The results above also show that from the concentration of
Table 6: Enzyme concentrations
Table 6 and graph B show that there is an increase in enzyme activity as the concentration increases from 10 microlites (0.01mg/ml) to 100 microlites (0.05mg/ml). This shows that there is a general increase in enzyme activity and that the graph shows a positive correlation.
Discussion:
Graph (A) page 9 shows a hyperbolic curve, which shows, when the concentration of enzyme tyrosinase is maintained constant; the reaction rate will increase as the amount of substrate (L-tyrosine) is increased. However, at first there is very little substrate and a lot of enzyme. An increase in the concentration of substrate means that more of the enzyme molecules can be utilized at some point; the graph shows that increasing the amount of substrate has no affect on the rate of reaction.
The line begins to level off and stay level at the concentration of (6.6x 10¯ 10) as all the enzymes are being involved in reactions. When this happens, some of the substrate must "wait" for enzymes to clear their active sites before the enzyme can fit with them (like a "lock and key") as explained in the introduction. This is said to be the maximum velocity of reaction. Graph A also shows that the normal pattern of dependence of enzyme rate on substrate concentration. This also shows that low substrate concentration the doubling of the concentration of L tyrosine will lead to a doubling of initial velocity. However at high substrate concentration (6.6x 10¯ 10) of the graph the enzyme becomes saturated therefore increase in concentration of L Tyrosine will lead to a very small change in maximum velocity.
After point (6.6x 10¯ 10) the reaction rate remains flat because increasing amounts of substrate must wait before they can fit with their enzyme. Therefore if the concentration of substrate is increased and the rate concentration of enzyme the reaction would proceed as normal as more active sites become available for the enzyme substrate complexes to be formed.
Graph B on page 10 shows a linear portion of the plot; increase in enzyme concentration keeping the concentration the substrate L tyrosine the same keeps the reaction on going as the properties of enzymes reflect the fact they are proteins. The rates in which enzymes catalyse reactions are often called its velocity. Enzymes velocities are normally reported at times zero since at this point the rate is at its fastest but at this point no product is present in this case L Dopa quinine. This is because the concentration of the substrate L tyrosine is greatest before any substrate has been transformed to product because the enzymes maybe subject with the reversible reaction as the products will reverse the reversible reaction.
Enzymes have a precise and delicate tertiary structure anything that disrupts this structure i.e. the rate of formation of enzyme-substrate complex (e.g. blocking the active site) will interfere with the enzyme activity. The graph shows a positive correlation between the substrate and enzyme and suggests that the rate is on going.
In conclusion my prediction was correct; the rate of reaction does increase as the substrate concentration increases. The reaction did increase up until the point where the enzymes are working at its fastest i.e. when all the active sites are filled all the time i.e. when saturation took place. On the other hand for the enzyme Tyrosinase re enzyme has a particular active site that have an exact shape to the substrate L tyrosine to form a substrate complex. As the substrate concentration was increased with the enzyme the rate of reaction also increased.
References:
Footnotes:
ul: millimolar
Nm: absorbance
H2o: Water
OH: alcohol
E = Enzyme
S = Substrate
P = Product
ES = enzyme substrate complex
M: molar
OD: Optical density
O2: Oxygen