- The distilled water in test tube 1 was poured into a tube designed for the colorimeter and was put in the colorimeter and the colorimeter was set zero.
- The solution in test tube 2 was poured into a sample tube designed for the colorimeter and was put into the colorimeter and the absorbance of was recorded.
- The colorimeter was set zero again by putting the tube with distilled water.
- Step 6 was repeated 4 times with solutions in test tube 3-6 and all of the absorbance was recorded. The colorimeter was set zero after using the tube of distilled water before every reading.
- A graph of meter reading against concentration of iodine was plotted and this graph was the calibration curve of the colorimeter.
(The graph was attached in the end of the report) (Graph 1)
- (Obtaining values for the concentration of iodine)
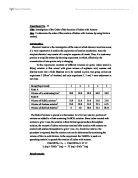
6 experiments were done for the whole class and our group was responsible for doing experiments a, f and g (varying volume of HCl added)
- HCl was added to a burette and propanone was added to another burette.
- For the first experiment (experiment a), volume of iodine solution, HCl and water were measured into a boiling tube according to the table below.
- Volume of propanone was measured out to a test tube according to the table below.
- The propanone solution was poured into the solution in the boiling tube and the stopwatch was started immediately.
- The tube was stoppered and inverted for a few times to ensure thorough mixing of content.
- A portion of the solution was poured into a sample tube and was put in the colorimeter every 30 seconds and the absorbance was recorded.
- Readings were taken at 30 seconds intevals for 6 minutes.
- Steps 10 to 16 were repeated twice for experiment f and g with different volumes of solutions and the data were recorded.
Observations:
- The colour of the mixture in experiments a,f,g were red-brown in colour and the colour became paler throughout the experiments.
- HCl and propanone were colourless while iodine was reddish-brown in colour.
Result:
Result for the calibrating curve
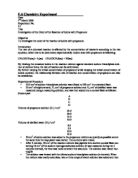
The concentration of [I2(aq)] in experiment a, f and g were found by comparing the meter reading with the calibration curve.
Experiment a
Experiment f
Experiment g
A graph of concentration of I2(aq) against time was plotted for experiment a, f and g (graph 2), and the graphs were attached at the back of the report.
Calculation:
In graph 2, -Slope = Rate of the reaction
-Slope for experiment (a) = = 2×10⁻⁴
-Slope for experiment (f) = = 4.2×10⁻⁴
-Slope for experiment (g) = = 6.67×10⁻⁴
Slope of experiment (f) ≈ 2 × Slope of experiment (a)
Slope of experiment (g) ≈ 3 × Slope of experiment (a)
For experiment (a), [H+] = 0.4 mol dm-3
For experiment (f), [H+] = 0.8 mol dm-3
For experiment (g), [H+] = 1.2 mol dm-3
Comparing experiments a and f, when the [H+] was doubled, the rate of reaction was around doubled.
Comparing experiments a and g, when the [H+] was tripled, the rate of reaction was also around tripled.
The rate of reaction was directly proportional to the concentration of H+(aq).
Therefore, we can conclude that the reaction was in first order with respect to H+.
The rate equation of the reaction
According to the result of the other groups, the rate of reaction was independent of the initial concentration of I2 and was directly proportional to the concentration of propanone.
Therefore, the rate of reaction was zero order with respect to iodine and in first order with respect to propanone.
The rate equation is:
Rate = k[Propanone][H+]
Experiment a Experiment f Experiment g
2×10-4 = k(0.4)(0.4) 4.2×10-4=k(0.4)(0.8) 6.67×10-4=k(0.4)(1.2)
k = 1.25 × 10⁻³ k = 1.31×10⁻³ k = 1.39 × 10⁻³
Average k = 1.32 ×10⁻³
Rate = 1.32×10⁻³ [Propanone][H+]
The overall order of the reaction is 1+1+0 = 2
Extrapolation of graph
The 3 lines in graph 2 were extrapolated to time = 0, he meaning of the y-intercept of the 3 lines are the initial concentration of I2, the y-intercepts of all three straight lines in the graph should be around 0.0040 as the initial concentration of I2 in experiments a, f and g were 0.004 mol dm-3.
But for the graph drawn, the y-intercepts of the lines are around 0.0042 to 0.0047. This may be caused by errors in the experiments or error in plotting the calibration curve or the lines as the data points are not all in the same straight line.
Discussion:
Comparing the stoichiometric equation with the rate equation
The stoichiometric equation does not have H+ in the reactant side but with iodine in the reactant side.
The rate equation has [H+], but does not have [I2].
This is because the stoichiometric equation only shows the reactant and products of the reaction while the rate equation only shows the substances that affects the rate of the reaction (including the concentration of reactant and the catalyst), but if a reactant or catalyst does not affect the rate of the reaction, it is not shown in the rate equation (for example concentration of I2 is not shown in the rate equation of the above experiment)
Sources of error in this experiment
- The temperature may slightly vary during the experiment
- The light bulb in the colorimeter may give slightly different light output each time.
- Different sample tubes were used, this may cause error as different sample tubes may have different optical characteristics and there may even be little dirt or scratches in some of the sample tubes.
-
The burette has a maximum error of 0.05 cm3, so there is a little error with added solutions from the burette.
- There is also error in the calibration curve as he curve was drawn by hand and the curve may not be too smooth or accurate.
Choosing filter for the colorimeter
When choosing filter of the colorimeter, we choose a filter of the complementary colour to the standard solution. Complementary colour
Only a small difference would be measured between white light before it passes through a colored sample versus after it passes through a colored sample. The reason for this is that the one color absorbed by the sample is only a small portion of the total amount of light passing through the sample.
However, if we could select only that one color or band of wavelengths of light to which the test sample is most sensitive, we would see a large difference between the light before it passes through the sample and after it passes through the sample.
Working principle of a colorimeter
A colorimeter Inside the colorimeter
The colorimeter is an apparatus that allows the absorbance of a solution at a particular frequency (color) of visual light to be determined. Colorimeters hence make it possible to ascertain the concentration of a known solute, since it is proportional to the absorbance. A colored sample typically absorbs only one color or one band of wavelengths from the white light.
The light source in the colorimeter gives out white light. The white light passes through an entrance slit and is focused on a ruled grating consisting of 1200 lines/mm. The grating causes the light to be dispersed into its various component wavelengths. The monochromatic design allows the user to select which specific wavelength of interest will be passed through the exit slit and into the sample. The use filters prevents light of undesired wavelengths (diffraction of higher order, stray light) from making it to the sample. The light detector measures the amount of light, which passes through the sample.
The difference in the amount of monochromatic light transmitted through a colorless sample (blank) and the amount of monochromatic light transmitted through a test sample is a measurement of the amount of monochromatic light absorbed by the sample.
Why do we need to draw a calibration curve for each of the colorimeter?
This is because each colorimeter is different especially the light source. Light sources in each of the colorimeters give out slightly different amount of light, so we each colorimeter is slightly different and the reading of the same solution may also be different for each colorimeter.
Why do we need to use a sample tube to test the sample but not just putting in the whole test tube?
This is because the sample tubes are specially designed which their thickness of their glass walls are more even. So that when light pass through the sample tubes, the lights are not affected too much when passing through the glass wall of the sample tube.
Reference: