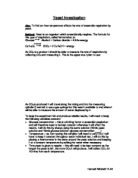
From the preliminary results I obtained, I found that the amount of gas given off was not substantial enough to provide adequate results if these experiments were performed in full. This means there were some fundamental flaws with the experiment that had to be confronted before I could continue.
One of the main problems with my preliminary work was that the concentration I used for them was too high for the yeast to function properly. As the yeast was surrounded by a solution with a high glucose concentration, it had a low water potential. As the water potential in the yeast cells were higher they moved down the gradient as shown in the diagram. As a result the yeast cells shrank and could not have the correct conditions for respiration, so many of them were inactive.
1.
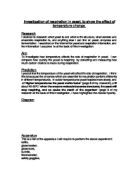
One way to combat this was to use a substrate solution closer to that in which they normally function. Therefore for further test runs I decided to run, I used 0.1 moldm-3 solution of glucose. This is 18g for every litre of water I use.
I also found that when I used 75% yeast to 25% glucose, too much of the glucose was used up by the yeast in the first few minutes while it was respiring aerobically. There were three things I could to make sure the gas was produced throughout.:
- Use a ratio of 50% Glucose to 50% yeast. This ensures that there is enough substrate for the yeast to produce gas for the time I want to measure
- I could add an initial amount of glucose solution that would be constant throughout. I would add this an hour before I added the full glucose solution. The purpose of this would be to activate the yeast into respiring anaerobically in time for when I start measuring gas output.
- I will measure gas output over 20 minutes and not 15 minutes. This is so that I would be able to see if more gas is given out over a longer period of time.
With these modifications in mind, I set about doing three experiments, all at 20% concentration. If I could get large enough results for the lowest concentration I am using then I thought I would be able to get a high amount of gas for all the other concentrations. Here are the results for the three experiments I did at 20% Glucose concentration.
As these results they are much more usable than the last set of results. Therefore I will use the settings described above in my actual experiments. These settings give much more substantial data and an insight to what I can expect in the actual experiment.
However there are still things wrong with this setting. When I finished timing the reaction; the reaction was still bubbling of gas. However this may not be a bad flaw as I am measuring the initial rate of the reaction. However I feel the method described later on in this section has one main flaw. It can incur a sizeable human error. This is due to reading meniscus lines and calibrating the test tube, to give a measure of the gas given off.
Method
- Firstly will obtain all the equipment as shown on my apparatus list shown earlier.
- I will then clean all equipment thoroughly with distilled water. This will go some way to ensuring that there is no contamination.
-
I will then turn the water bath on and set it to 40oC. I will leave some time for it to heat the water up to the correct temperature. The temperature will be checked at regular intervals.
-
I will then stir 5g of dried bakers yeast into every 100cm3 of water, and make sure that the solution is of a regular colour throughout, so that the yeast is evenly distributed. This will be done in a 1000cm3 beaker, which will be placed in the water bath for 30 minutes before the experiment. This will be done to ensure that any oxygen dissolved in the water is respired aerobically, this will also go some way to activate the yeast.
- I will then make the glucose solution. This will be done by adding 18g of powdered glucose to a litre of water. This will be my 100% solution. This will then be placed into the water bath to allow its temperature to reach the correct value.
- I will then set up a boiling tube rack in the water bath, to hold the boiling tubes while the experiment is going on.
-
As the boiling tubes have no graduations on them, and gas needs to be measured in them, they have to be graduated in some way. I will give them 1cm3 graduations on them. This will be done by accurately measuring out 1cm3 into a small measuring cylinder. This will then be poured into the test tube and where the meniscus is, that point will be marked with a straight line with a thin marker pen. This will be done nine more times until there are 10cm3 of graduations on the test tube. This is the calibration of the tubes, so that they can measure the amount of gas given off.
-
After the glucose have reached the correct temperature, I will measure 10cm3 of it in a measuring cylinder, and put that in the bottom of the test tube.
-
10cm3 of yeast will then be measured out using the same method and place in the test tube.
- Then as quickly as possible, invert the test tube inside a larger boiling tube and place in the test tube rack. Then set the timer for 20 minutes
- Repeat this step for the other repeats of this concentration and give each experiment its own timer.
- After 20 minutes measure the amount of gas given out by reading where the meniscus level is on the test tube. Where this is, is the amount of gas that has displaced the liquid inside the tube.
- Wash out all equipment and perform Steps 8 - 12 again for all the concentrations. 80%, 60%, 40%, 20% and 0% (control)
Justification of method and equipment:
The method I am using is very simple to set up and perform and is therefore feasible in the timeframe that I have. It is easily repeatable so I can gain a lot of data that is close to a hypothesis. This method is also very safe and has been known to produce good results in the past. Also the equipment I have can measure to a degree of accuracy that is suitable for this experiment. For example the water bath and thermometer are both accurate to half a degree Celsius so will help to give reliable data.
As I collect my results I shall graph the figures gained. This will allow me to know if there is a trend emerging, or if there were any significantly anomalous results. Also when I get an anomalous result, I shall ignore it when processing my data, and instead perform another repeat under the same conditions so I still have three repeats to analyse. All my readings will be taken to a suitable degree of accuracy. Therefore all measurements will be done to the nearest 0.1cm3. This also to all calculations I make.
Hypothesis
Will the rate of reaction increase with substrate concentration?
I predict that as the substrate concentration increases, the rate of reaction will also increase. This will do this up to a point where increasing concentration will no longer increase the rate of reaction.
Theory Justifying Hypothesis
There are two main areas of biology behind my prediction. One is factors affecting enzymatic activity and the other is factors affecting Glycolysis and the Ethanol pathway in yeast.
One of the factors affecting the rate of an enzyme controlled reaction is substrate concentration. In the case of this reaction, there are numerous enzymes, but the initial substrate is Glucose. The concentration of glucose is the amount of Glucose in a given volume; for the purpose of this experiment it is in 10cm3. In order for a reaction to take place there needs to be a collision between the substrate and the enzyme. The more molecules of substrate there are in a given area, the more chance there is of a random collision with the active site of an enzyme, and it is therefore more likely to form an enzyme-substrate complex, and hence be reacted. The diagram below shows how changing the number of units per volume.
To form an enzyme-substrate complex the substrate must exactly fit into the active site of the enzyme.
The reason for enzymes being so abundant in living organisms is that they lower the activation energy of reactions. They do this when the complex is formed and the enzyme shape applies pressure to certain bonds in the substrate and make it easier to break these bonds, thus requiring less energy. The diagram below summarises the reaction:
3.
The theory on which enzyme reactions is based is called the lock and key theory. This means that enzymes have strict active sites, and the process of the reaction is summarised below.
2.
This reaction just one substrate entering the active site and being broken into its products. This links in with my hypothesis, as the higher concentration of substrate the less time an enzyme has to wait before it can help perform the next reaction. This in turn will link to the second part of my prediction.
There will be an increase in rate of reaction with concentration up until a point. However there will come a point when the enzyme is catalysing the reaction as fast as it can and increasing the substrate concentration past this point will cause no further increase in rate of reaction. The reaction has reached its maximum speed and this point is called Vmax. The graph below shows what I expect to obtain from my results:
4.
The collection of reactions that break down glucose is called glycolysis, and takes part in the cytoplasm of cells. This is the set of reactions that turn glucose into pyruvate. The purpose of changing glucose into water and carbon dioxide in aerobic conditions, lactate in most anaerobic conditions and ethanol and carbon dioxide in yeast, is to turn ADP and a phosphate group into ATP. ATP stands for adenosine triphosphate, and contains a nitrogenous base a sugar and three phosphate groups. A picture of the structure is shown below
8.
ADP + Pi ATP
The purpose of this is that ATP has a high energy bond with the last phosphate group a value of 32KJ/mol. This is used to perform other reactions essential to the organisms working. 11.
This process of reactions is entirely enzyme controlled and relies on 10 enzymes to work. Therefore if the initial substrate is in a high concentration there will be an increase in products which are in turn substrates in other stages of glycolysis. This in turn will cause an increase in production of pyruvate which can then under aerobic conditions go into the link reaction to combine with Co enzyme A, and continue respiration. After the link reaction it combines with citric acid in the tricarboxylic acid cycle. This in turn goes onto oxidative phosphorylation, which yields 32 ATPs per glucose molecule. However when there is little or no oxygen the enzymes that control these processes get clogged up with products that cant be converted into anything further. This therefore just produces pyruvate, and this will stop glycolysis working if it were not converted into anything else. The diagram below shows all the reactions in glycolysis and all the enzymes involved:
7.
Some organisms like yeast get round the problem of pyruvate stopping glycolysis working by converting it into ethanol. This does not yield as much ATP as aerobic respiration but still has a net yield of 2 ATPs. It does this by using the NADH+ formed in glycolysis to turn the pyruvate into ethanol which then can be broken down separately. The NADH+ is oxidised back to NAD. NADH+ is a Hydrogen ion carrier that is used later in oxidative phosphorylation to form more ATP. However in this case it gives back hydrogen ions back to pyruvate. Here is a diagram of NADH+
9.
Figure 10. Shows how the pyruvate gets to ethanol:
10.
From this theory I can make the quantitative prediction and say that as concentration of substrate doubles so will rate of reaction. I.e. there should be twice as much gas given off at 40% than at 20%.
Bibliography
-
2.& 10.
3. Online Biology textbook accessed via
4.
5.
6.
7.
8. & 9.
11. Additional resource: Cambridge advanced sciences Biology 2
Table of results
In order to find the rate of reaction I divide the amount of gas given off by time elapsed in minutes.
N.B. The result shaded in red is anomalous.
These graphs have been drawn from my data and I will be able to draw conclusions from them later on.
This second graph shows rate of reaction against the substrate concentration:
Analysing Evidence
From my graph I can draw many conclusion. One such is that there is a strong positive correlation on the graph which suggests that the data lies on predicted line I expected it to. Also I can see that as the substrate concentration goes up so does the rate of the reaction, this gives a good indication that there is a direct proportion between concentration and rate of reaction. In conclusion I feel that the data I collected can be used in an investigation to investigate rate against concentration. Also I believe that my initial prediction was confirmed which was that rate of reaction will rise proportionally to substrate concentration, up until a maximum rate of reaction. This brings me onto my second conclusion.
At 100% concentration the graph seems to level off and no longer maintain a linear relationship between the two variables. It does not totally plateau off, but the rate of reaction does seem to stop increasing at the same rate as before. This gives me reason to suggest that if I were to increase the concentration further to 120% and 140% of 0.1mol/dm3, then I would find that the rate of reaction would not increase any further than the value V max.
The lines of best fit that have been drawn on my graph both go through the origin. This gives some evidence that my data supports my theory because in reality if there is 0% concentration of my substrate then there should be no reaction taking place; this was shown in my results.
Overall I feel that my theory has been supported by my results. In my planning section I described how that as concentration of glucose increased initially, so did the rate of reaction. This was because as the concentration increased it meant there were more substrate molecules in the yeast mixture. As all molecules move in a random way, it means that reactions only take place by chance. If there are more substrate molecules in the space to be reacted there is therefore a higher probability of a reaction taking place at any one time. On a larger scale it means there will be more reactions per second, hence there will be higher rate of reaction. From my results this trend was obtained. A linear increase of rate of reaction with substrate concentration. This is because if there are twice as many substrate in a given space then there will be twice the chance of a substrate entering the enzymes active site, forming a complex and being reacted.
In my planning I predicted that the graph would plateau off at a certain concentration. This was because enzymes can only perform so many reactions per second as it takes a finite amount of time to form a complex and transition to a enzyme-product complex and for the product to leave the active site. This means that if there are more substrate molecules colliding with the enzyme than it can catalyse in a given time then the rate of reaction is not going to increase even if the concentration is increased. From my graph I found this levelling out effect to a certain extent but it did not level out enough for my conclusion to be firm. However the small levelling off there was does imply that if the investigation was extended this levelling out effect would be more pronounced.
Finally I believe that my results provide strong evidence that my prediction was correct.
Evaluating Evidence
In terms of resources and results obtained I believe that the method if my investigation was very suitable. This is because I set out to prove or disprove a hypothesis. From analysing my results I feel that to a large extent I have done this. As the procedure was safe, easy to repeat, and all resources were easily obtainable and that I only got one anomalous result at 80%, I feel that this investigation was suitable.
By studying the results I obtained relative to each other I found that I had one result that did not fit the pattern I expected it to. It was the first experiment at 80%. It was below my other two experiments by nearly 50%, and the difference between it and the other two repeats was more than the difference between different concentrations, it is fair to say that this result was anomalous. In order to make sure that this anomalous result did not affect my analysis I ignored it and performed another repeat to make sure that it was close to the other repeats.
There are numerous reasons for my anomalous result. One of the reasons could have been that the equipment used for the experiment was not cleaned out thoroughly enough and a contaminating inhibitor may have been introduced to the yeast. An inhibitor is a chemical that suppresses action. There are two main types of inhibitors, both of which can be permanent or temporary. One is a competitive inhibitor. This type of inhibitor has a similar shape to the substrate and therefore fits in well in the enzymes active site. This stops enzyme action as it blocks the active site stopping substrate molecules entering it and being catalysed. The other type is non competitive inhibition. These inhibitors bind to other sites on the enzyme called allosteric sites. When it does this it causes a ripple effect throughout the enzyme causing all the hydrophobic regions to shift in order to compensate for the inhibitors presence. This has the effect of distorting the shape of the enzymes active site so that substrate molecules can no longer fit in the active site and therefore cannot be catalysed.
Another reason for my anomalous results was that the particular yeast cells used in that experiment were inactive. This could have been due to contamination or there may not have been enough other nutrients in the yeast solution to keep this particular batch of yeast active. This is unlikely as other yeast cells from the same batch all performed normally.
Even though I obtained data supportive to my prediction there were some limitations to my experiment, that could have increased the error incurred. One is that the equipment I used were only to a set degree of accuracy. For example the gas measuring cylinder was only accurate to 0.1cm3 as were all the equipment used to measure out solutions. Also the thermometer in the water bath was only accurate to 0.5cm3 and this meant that the water bath could only be that accurate. My other source of main limitation is that the all yeast cells are different and that all of them have different amounts of enzymes required for the reaction. Therefore this means that I cannot be certain that the same number of enzymes were present in each batch of yeast cells.
To see how accurate my data is I can use a statistical formula to see how close my data is to my line of best fit. This is called finding the product moment correlation co-efficient. If the value is close or is 1 then there is a strong or perfect positive correlation. If the PMCC is -1 there is a perfect negative correlation, if the value is 0 then there is no linear correlation. The formula for this value is:
c= concentration
r= rate of reaction
PMCC = Scr / √SrrScc
This value can be worked out on a calculator and when I put my values for concentration and rate of reaction I got a value of 0.9992 as the PMCC. This means that my data is very close to my line of best fit and the data is strong enough to support a solution.
Even though I obtained good accuracy there are still sources of error in my investigation that need to be addressed. One such is that the method of trapping gas in a tube to measure it can cause much human error from taking readings of a meniscus. And also in measuring out solutions this can mean amounts are out be up to 0.1cm3. However I feel that such errors are small enough to be considered irrelevant.
To further extend my investigation I could use more repeats at extended amounts of concentrations to see if the graph would level out. I could also compare how different respiratory substrates compare to glucose in producing a rate of reaction. I could use various sugars like sucrose, or I could use different fats or proteins.
To further improve my investigation I could use different equipment that measured out things to a higher degree of accuracy this would make me more certain of my data. I could also use a different method of obtaining a rate of reaction. Instead of finding how much gas was given off after 20 minutes, I could measure the gas given off at time intervals and making a graph of gas given off against time, then finding the initial gradient of these lines and using that as the rate. This can also be used to justify how enzymes work. The initial increase in gas given off is steep. This increase then slows down and eventually plateaus off when all the substrate is used up. The concentration when the initial gradient of the graph is no longer increasing would be when the reaction has reached Vmax.
Another improvement could be to use an activator like orange juice or yeast extract to make the yeast more active. This would help get more substantial amounts of gas to analyse. Another method of collecting gas could be to use a manometer. This is a thin tube that when filed with water moves along a measuring device when gas displaces it. This could be used to see how much was given off in a more accurate way.
Overall I feel that even with one erroneous result, my data and results are good enough to make a firm conclusion as the errors were not significant enough to make a difference to the accuracy of my results.