I used these concentrations because they would be easy to make up in the test tubes. Making smaller concentrations, e.g. 1.0, 9.5, 9 etc would show only slight changes and it would be easier to make a measuring error. And going with bigger concentrations such as 1, 0.8, 0.6 could show large changes. If the best reading was somewhere in the middle, for example between 0.4 and 0.6 I wouldn’t know if it was 0.4 or 0.5 or somewhere in-between because the gaps are too large.
Table to show the range of concentrations I will take:
Controls
Negative control will be:
- 15ml of starch – without any enzymes this should definitely not work
Positive control will be
- 7.5ml of starch and 7.5ml of enzymes – this will work because there is an equal amount of both which worked in my preliminary experiment. These will both have a thermometer in them to make sure the water temperature is 40°
Reliability
To make sure my results are reliable I will repeat the test 3 times and compare and average the results. This will make it easy to see anomalous results. I will need to be precise with my measuring and timing to get the best results.
Safety and risk assessment
- Wear goggles to protect eyes
- Tie back hair so it doesn’t drop into experiment
- Wear lab coat to protect clothes from spillage’s
- Parts of waterbath could be very hot – beware for burns
- Make sure spillage’s are mopped up – people could slip
- Care should be taken using iodine, as contact with the skin can cause lesions; iodine vapour is intensely irritating to the eyes and mucous membranes
Preliminary experiment
For the preliminary experiment I tested what temperature was the best for the enzymes to work. Because human temperature is 37°, I thought 40° would work best and I was correct. These were the results:
On the next page is the ‘enzyme lab’ work with concludes that 40° is the optimum temperature and pH7 is the optimum pH. Using both of these sources I will be able to plan the method.
My preliminary experiment’s method was good and reliable so I will use the same one with small changes to suit this experiment.
Method
- Prepare a dimple tray with equally sized iodine blobs using a pipette
- Measure out 10ml of amylase and 5ml of starch using different measuring cylinders and put them both in a test tube which should be put placed in the water bath at 40° beforehand
- Start the timer
- Every 30 seconds take a drop from the solution in the test tube and drop onto the iodine using a pipette
- If it turns blue/black continue
- Continue to take a sample every 30 seconds until the iodine stays orange
- Note the time it took in seconds
- Repeat this twice more
- Go onto the next set of observations; 9ml of amylase, 5ml of starch and 1ml of water
- Repeat the above
- Keeping doing the test for all 10 concentrations.
Implementing
A table to show the results of the experiment
Analysing
Trends
From the results I can see there is a trend for the length of time to increase to make the iodine stay orange, as the concentration of enzymes decreases. Therefore the less enzyme concentration, the longer it takes for the starch to turn into maltose. From the data I made this table, and produced a graph (see graph paper):
Conclusion
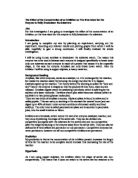
An enzyme is a protein that acts as a catalyst in biochemical reactions. Each enzyme is specific to a particular reaction or group of similar reactions, amylase being specific to starch.
The molecule undergoing reaction (the substrate - starch) binds to a specific active site on the enzyme molecule to form a short-lived intermediate; this greatly increases the rate at which the reaction takes to form the product; maltose. The properties of an active site are determined by the three-dimensional composition of the polypeptide chains of the enzyme and their basic amino acids. These rule the nature of the interaction that takes place and therefore what substrates can be reacted. Enzymes can be used over and over again, since the active sites do not change shape after the substrate has reacted with it.
Therefore no matter how many enzymes, a reaction will always take place, just at varying lengths according to the amount of active sites (and hence enzymes) present. If only a few enzymes are present, then the reaction rate will be much longer than if a larger number of enzymes were present with the same amount of substrate.
If there are more enzymes, there is also a greater chance of their active sites colliding into the substrate to form the product. Since the temperature was 40°, the optimum temperature, the enzymes and substrate had the greatest chance of meeting as they had the greatest amount of kinetic energy. Kinetic energy is the amount of energy the particles have to move about. The more enzymes, the more times the substrate will meet and therefore produce the maltose. Any higher than 40° would make the particles have even more energy to collide, however the enzymes would become denatured and therefore not be able to work at all.
My results show that this conclusion is correct. For example at the lowest concentration, 10%, it took the longest time for the iodine to stay orange, 660 seconds. As the percentages went up, the time went down.
100% is the best possible amount of enzymes, because there is the maximum amount of enzymes and therefore the reactions would take the minimum amount of time.
Evaluation
The method I used was suitable to the experiment because it obtained fairly accurate results and I had no problems with the equipment I used. Everything was the right size and the experiment went well without any safety issues.
Anomalous results
I have two anomalous results. The 1st is at 70% concentration of enzyme. The 3rd time gave me 270 seconds when the other two were 180 and 180. The 270 seconds even surpasses the 60% concentration, which were at 270, 240 and 240 seconds.
The second anomalous result is at the 10% concentration. The times were 600, 750 and 630 seconds; 750 being clearly longer than the other two.
There are many reasons that I may have had slightly inaccuracies leading to anomalous results. Such as the fact that the amounts I was measuring were very small, and I could have accidentally used too much or to little of the substrate and/or the enzyme. Also it was quite hard to tell when the iodine didn’t react anymore, as the colour changes towards the end were very slight. I may have cut the experiment short by not seeing the colour change, or waiting to long thinking it would go slightly lighter. The drops from the pipette of the amount of iodine as well as the solution may have also varied in size. With more iodine, it takes less time for it to stay orange. With less iodine it takes longer. Vis versa happens for the solution when added to the iodine. Time was another inaccuracy, it was hard to get it on extra 30 seconds.
Errors
The main sources of error were probably the amounts of enzyme and substrate I measured, and the exact length of time, 30 seconds, between each reading. The amounts I measured were small and therefore hard to get perfectly, and it was hard to get a blob of the solution exactly every 30 seconds. I may have taken the blobs anywhere between 29-31 seconds. Although this isn’t a large time difference it may have made a significant difference in my results. The main source of error was definitely measuring the small amounts of enzyme and substrate.
The method I used assumed the readings would be to a great degree of accuracy; however the results I got weren’t totally inaccurate because the three different readings of each concentration are all very similar.
Because of these small errors, my results will be affected in that the reaction rate could be slightly faster or slower. The amount of iodine in the blobs and the amount of solution may have given misleading times of when the experiment had finished.
To improve and make the experiment better I could do more readings closer together, e.g. 95%, 90%, 85% etc. I could also use bigger amount, instead of 5ml of starch I could use 10ml, and 20ml of varying amount of enzyme and water. This would make it easier to measure the amounts. Time was a hard variable to control. And therefore I could do an experiment on a different factor such as pH.
To make even more improvements I could make sure the solution is fresh and not already made up. I could use pH paper with all the experiments to make sure they are all at 7, if I were to do ‘time’ again. I could find a different method of finding out if they still contain starch, as iodine is a bit unreliable and compare the results with graphs.
Reliability
The results are quite reliable since I did the experiment 3 times with each concentration. The results are all similar in the times. The times are usually the same, or only vary 30 seconds either way. However I repeated the tests one after another, and therefore the same “error” could have occurred in all three of the tests. To improve I could do another set of repeats but at a different time, to see if they still have the same results.
The results I have agree with my original prediction, scientific background and conclusion and therefore are accurate to a degree. Although I cannot say if my results are correct and that if I do the experiment again they will always be those exact results, they show the correct trend and look reasonable.
Implementing
A table to show the results of the experiment
Analysing
Trends
From the results I can see there is a trend for the time to increase to make the iodine stay orange, as the concentration of enzymes decreases. Therefore the less enzyme concentration, the longer it takes for the starch to turn into maltose. From the data I made this table, and produced a graph (see graph paper):
Conclusion
An enzyme is a protein that acts as a catalyst in biochemical reactions. Each enzyme is specific to a particular reaction or group of similar reactions, amylase being specific to starch.
The molecule undergoing reaction (the substrate - starch) binds to a specific active site on the enzyme molecule to form a short-lived intermediate; this greatly increases the rate at which the reaction takes to form the product; maltose. The properties of an active site are determined by the three-dimensional composition of the polypeptide chains of the enzyme and their basic amino acids. These rule the nature of the interaction that takes place and therefore what substrates can be reacted. Enzymes can be used over and over again, since the active sites do not change shape after the substrate has reacted with it.
Therefore no matter how many enzymes, a reaction will always take place, just at varying lengths according to the amount of active sites (and hence enzymes) present. If only a few enzymes are present, then the reaction rate will be much longer than if a larger number of enzymes were present with the same amount of substrate.
If there are more enzymes, there is also a greater chance of their active sites colliding into the substrate to form the product. Since the temperature was 40°, the optimum temperature, the enzymes and substrate had the greatest chance of meeting as they had the greatest amount of kinetic energy. Kinetic energy is the amount of energy the particles have to move about. The more enzymes, the more times the substrate will meet and therefore produce the maltose. Any higher than 40° would make the particles have even more energy to collide, however the enzymes would become denatured and therefore not be able to work at all.
My results show that this conclusion is correct. For example at the lowest concentration, 10%, it took the longest time for the iodine to stay orange, 660 seconds. As the percentages went up, the time went down.
100% is the best possible amount of enzymes, because there is the maximum amount of enzymes and therefore the reactions would take the minimum amount of time.
Evaluation
Experimental procedures
The method I used was suitable to the experiment because
.
Anomalous results
I have two anomalous results. The 1st is at 70% concentration of enzyme. The 3rd time gave me 270 seconds when the other two were 180 and 180. The 270 seconds even surpasses the 60% concentration, which were at 270, 240 and 240 seconds.
The second anomalous result is at the 10% concentration. The times were 600, 750 and 630 seconds; 750 being clearly longer than the other two.
There are many reasons that I may have had slightly inaccuracies leading to anomalous results. Such as the fact that the amounts I was measuring were very small, and I could have accidentally used too much or to little of the substrate and or the enzyme. Also it was quite hard to tell when the iodine didn’t react anymore, as the colour changes towards the end were very slight. I may have cut the experiment short by not seeing the colour change, or waiting to long thinking it would go slightly lighter. The drops from the pipette of the amount of iodine as well as the solution may have also varied in size. With more iodine, it takes less time for it to stay orange. With less iodine it takes longer. Vis versa happens for the solution when added to the iodine.
Errors
The main sources of error were probably the amounts of enzyme and substrate I measured, and the exact length of time, 30 seconds, between each reading. The amounts I measured were small and therefore hard to get perfectly, and it was hard to get a blob of the solution exactly every 30 seconds. I may have taken the blobs anywhere between 29-31 seconds. Although this isn’t a large time difference it may have made a significant difference in my results. The main source of error was definitely measuring the small amounts of enzyme and substrate.
The method I used assumed the readings would be to a great degree of accuracy; however the results I got weren’t totally inaccurate because the three different readings of each concentration are all very similar.
Because of these small errors, my results will be affected in that the reaction rate could be slightly faster or slower. The amount of iodine in the blobs and the amount of solution may have given misleading times of when the experiment had finished.
To improve and make the experiment better I could do more readings closer together, e.g. 95%, 90%, 85% etc. I could also use bigger amount, instead of 5ml of starch I could use 10, and 20 of varying amount of enzyme and water. This would make it easier to measure the amounts. Time was a hard variable to control. And therefore I could do an experiment on a different factor such as pH.
To make even more improvements I could make sure the solution is fresh and not already made up. I could use pH paper with all the experiments to make sure they are all at 7. I could find a different method of finding out if they still contain starch, as iodine is a bit unreliable and compare the results with graphs.
Reliability
The results are quite reliable since I did the experiment 3 times with each concentration. The results are all similar in the times. The times are usually the same, or only vary 30 seconds either way. However I repeated the tests one after another, and therefore the same “error” could have occurred in all three of the tests. To improve I could do another set of repeats but at a different time, to see if they still have the same results.
The results I have agree with my original prediction, scientific background and conclusion and therefore are accurate to a degree. Although I cannot say if my results are correct and that if I do the experiment again they will always be those exact results, they show the correct trend and look reasonable.