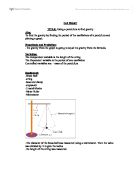
-the bob was pulled to the side and released
-the time was started when the bob passed the reference line.
-a full oscillation is when the bob passes the reference line forth back and forth again.
- the length of the string is increased or decreased in a regular pattern
- the time was monitored by reading through the stopwatch.
-the same brass ball was used over the experiment to keep the mass constant.
- the length was varied 10 times with a 10 cm difference.
-4 readings were taken for each 10 cm
-the time was taken for 20 oscillations. And then divided by 20 to give one oscillation.
Data Collection:
The table contains the length of the string in meters, the number of oscillations, the time per 20 oscillations and the period of one oscillation.
- As the length of the string deceases , the time for 1 oscillation decreases. So the length of the string is directly proportional to the period.
Data Processing and presentation:
Example in working out average period when the string is 1.01 m:
1.9825+2.0965+1.991+1.997=8.067
8.067/4=2.01675
The same procedure is used for the rest.
The graph is plotted with Average period squared against length of string.
Y=3.9244x-0.0087
3.9244=gradient.
3.9244= (4(pi)^2)/g
g = (4(pi)^2)/3.9244
g=10.060 from the graph.
The average gravity from the formula=
100.614/10= 10.614
Conclusion:
- the results where very close to the prediction but they weren’t the same as the graph is a scatter diagram.
-the result from the graph is more accurate as the graph cancels inaccurate measurements.
Evaluation:
-the method had weaknesses.
-the angle of the pendulum to the reference line isn’t the same in each reading which might cause a slight error.
-the Air conditional may effect the pendulum; it may change its speed or change its direction.
- it is difficult to stop the stopwatch and start it in the reference line exactly which might induce error
- sometimes the ball tends to move in a circular motion and the experiment will have to be repeated.