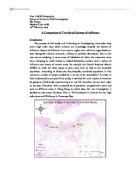
Life expectancy
This map (see above) shows the life expectancy levels in wards, across Harrow.
The map shows us that the life expectancy levels across the borough are generally low- they’re mostly around 78.5 years to less than 80 years, and 80 years to less than 81 years.
The map shows us that generally the centre of the borough has got the lowest life expectancy levels in the borough, with a life expectancy of 76-less than 78.5 years and 78.5-less than 80 years. The areas with the highest life expectancies in the borough are the far north east where Cannons is located, with a high life expectancy of 81.5-less than 83 years, and the far south east, where Edgware is located, with a life expectancy of 81-less than 81.5 years. In general, I think that the graph shows us that the west-north /west of the borough has got the highest life expectancy, with mostly a life expectancy of 81.5-less than 83 years; the north-west has got a high life expectancy of 81-less than 81.5 years.
Street crime-darker area=more street crime
This map (see above) shows the levels of street crime in wards, across Harrow.
The map shows us that generally, fairly high levels of street crime are quite widely dispersed across the borough, the fact that there is no legend available for this map makes it less reliable.
The centre of the borough seems to have the most amount of street crime, as generally, there’re darker areas are more concentrated, with Greenhill in the south having the highest level of crime as it is the darkest area. The whole of the eastern section of the borough also seems to have a high indicator for crime levels- where wards like Cannons and Edgware are located, as there’re lots of dark areas and they’re highly concentrated. The north/ west have got the lowest indicator levels for street crime, as there’re a lot of light areas that are fairly highly concentrated, wards like Pinner, Hatch End, Headstone north, and Pinner south are located.
Income-darker=less income, lighter=more income.
This map (see above) shows us the levels of income in wards, across Harrow.
The map shows us that generally fairly low income levels are widely dispersed across the borough, the fact that there is no legend available for this map makes it less reliable.
The south of the borough seems to have a lower indicator level for income, as these areas are darker and highly concentrated, where wards like Greenhill, Marlborough, and Kenton are situated. Generally the east of the borough seems to have the low levels of income too (second after the centre). The north west section of the borough seems to have fairly low levels of crime as there are lighter areas, wards like Pinner, Hatch End, Rayners Lane, and Headstone north are located.
Conclusion
By comparing the 4 variations between the standards of living in Harrow for all 4 of the GIS maps, I have found that in general, the north west of the borough has got the lowest indicators for street crime, and population density, while having the highest indicators for life expectancy, and income. I think this is due to the fact that the categories may be interdependent. I think that because people in the north west generally have a higher income compared to the rest of the borough, so this could’ve had an impact on the other results from the other categories, e.g. the reason why there is a low indicator for population density in the area could be because the house prices are higher in this area, so people can’t really afford to live in this area (as the majority of the rest of the borough seem to generally have a lower income level). Also, the results suggest that street crime levels are generally low in this area because of the low indicator of population density in this area.
I have also found that in general, the south/west of the borough has got the highest indicator for population density levels, street crime levels, low income levels, and a low indicator for life expectancy levels. I think that this is due to the fact that the categories may have a correlation. I think that because people in the north west generally have a high indicator for population density levels, as they may have a low income compared to the north west of the borough (which has a high indicator for income), so they can’t really afford to live in the north west, this could also be the reason why generally street crime levels are higher in the south east, because of the high indicator for population density. Also, the reason that the area in general has a low indicator for life expectancy may be because of the larger amount of people who live there.