Background Knowledge
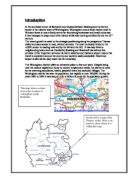
Land use models are theories, which attempt to explain the layout of urban areas. A model is used to simplify complex, real world situations, and make them easier to explain and understand. There are two main land use models that apply to urban areas in MEDCS (More Economically Developed Countries). The first is known as the Burgess model. Which can be applied to Wokingham.
It shows how a towns land use changes from the CBD to the periphery.
This is the second model, which displays the same idea as the Burgess Model but in a slightly more detailed way. But again this shows how the land use changes from the CBD to the periphery.
Other Background studies
Key
This is an example of a settlement hierarchy, which includes Wokingham. The higher up the pyramid you get, the bigger the settlement is, but there are less of them. However high up the settlement hierarchy a settlement is, it depends on how big it is and also what services it offers.
Glossary of Terms
CBD – Central Business District is the centre of town is and the main shopping centres are.
Isoline Map – this map changes the different areas of different values by colour coding.
Density Dot Map – this map shows the points of value in the certain area.
Primary Data – this is data that has been collected in note form and is a source that will be written up in the second section.
Secondary Data – this data was note collected by myself but found out of books of the Internet.
Periphery – This is another word for the boundary of the settlement being studied.
Settlement – this is the place in which people live
Transect- Periphery area of a town
Collection of results
Key for the collection of results.
On the next page of my coursework I have put together a table of results so that they can be displayed easily and I can draw up results quickly and efficiently.
- First column is just to show the number of points along each road where I stopped and collected results.
- Second column shows the number of cars counted in a set time for each point of 5minutes.
- Third column is the same but taking a pedestrian count.
- Building height this indicates the number of storeys of the building at these points. The number in my table of results will indicate the number of storeys.
- Building age for this column I have made a number of groups in which the each building will go into depending on its age.
A-1975
B-1950
C-1925
D-1900
E-before 1900
- The last three columns describe the use of each building on each of its floors.
Different types of land use
The is the key aspect of my project using the updated goad map which is shown on the next page I have used a colour key in order to display my results in a clearer easier way. Using different colours I have coloured in all the different types of buildings and there have come under the following headings.
Residential: This is the housing area, located in mass on the periphery of the town, which is shown clearly beginning of the end of Peach and Broad Street.
Retail: These are shops, mainly low order goods i.e. bread and newspapers, but also shoe shops and notice how they cluster.
Catering and Entertainment: This includes restaurants, take-a ways and fast food stores. Pubs are also included, Wokingham as an old English town means there are a fair number if pubs typical of any old English old settlement.
Professional and Commercial: Financial enterprises are typical of clustering as they do on Broad Street.
Public authorities: A classic example of this is town hall and library on the periphery of the CBD.
Offices: This is self-explanatory.
Vacant Outlets: These are shops that are ‘not in use’
Industry: There is little industry in the area of Wokingham.
Presentation of Data
- The first way I am going to display my data is to show the Traffic count and pedestrian count on scatter graphs.
- Then I will also display the results as Bar Charts so that I can get a clearer and therefore a better look at my results.
- For each of these I am going to use spearman’s rank as this will give me an idea of how well I collected my data
- For both Building height and building age I will be able to use the method of using isoclines maps as this will give a good idea of where the results where collected from and how areas of Woking ham compare to other areas in Wokingham.
- For the land use I have collected a number of photos, which will be used as a good visual aid to show the difference of land use between the centre business district and the periphery.
Spearman’s Rank
I am now using spearman’s rank to find out if my results give a good correlation. This now gives a good idea of how good my results are using techniques outside the field of geography.
This is for the pedestrian count along the Reading Road.
Total = 484
London Road
Total= 445
Finchampstead Road
Total = 259
Spearman’s rank
Now I am going to spearman’s rank for traffic, as again it will give another good representation of how well I have collected my results.
Reading Road
Total = 42
London Road
Total= 76
Finchampstead Road
Total = 302
Description and explanation of Data Representation.
Coloured Goad Map
On the last page there is a full-scale map of the Central Business district of Wokingham showing the different land uses. I have made the map clearer by using different colours according to the key.
As we can see by looking at the goad map I have coloured in the different types of land use in different colours so as to highlight the change in land uses. As I have already mentioned that by using the key you can determine the land use by matching it up to the correct colour.
By using the goad map it gives a very clear idea that the central business district of Wokingham follows no obvious pattern of land use. As you can see from the map the Central Business District of Wokingham is heavily dominated by retail stores and parking lots. This corresponds with most typical Central Business Districts.
Below is a table that I have taken from a specific coursework book which relates to the project that I am investigating. The table below will determine whether Wokingham is a typical Central Business District.
The correlation table again shows that Wokingham’s Central Business District is the same as any other. Therefore two conclusions can be drawn from this.
- Wokingham corresponds to a typical central business district
- Wokingham is a typical central business district
This relates back to one of my hypothesis very closely:
Shopping, other small companies and offices will take up most of the land right in the centre of Wokingham; there will therefore be a low percentage of residential properties.
This is shown very well by using the goad map.
Description and explanation of Data Representation.
A graph displaying how the height of a building is affected by distance from the Town centre
On the three pages before are scatter graphs showing the how the height of buildings varies as you move further away from the centre of town on Reading road, London road and Finchampstead Road.
In order to collect my data as you can see in the table of data I have taken an average height of two buildings one from either side of the road on each of the three roads at intervals of 50 meters. (50m, 100m, 150m…) This would work in the following way for example if I was to record building on either side with a height of 2 storeys I would add them together and divide that my 2 in order to find the average which would be 2 in this case. For each road on the graphs I have put the building height on the y-axis and the x-axis will be the points along which I collected my data. Then I turned my data into the three separate graphs for each street.
By looking at the three graphs opposite and the results that I collected we can clearly deduce that as you move away from the town centre of the Central Business District to the periphery of the Central Business District the average height of building decreases. The trend lines on the graphs are pointing downwards with the highest point nearest to the y-axis and the lowest point nearest to the x-axis. The trend lines immediately tell us that therefore the highest buildings are closest to the town centre and the smallest buildings are nearer to the periphery. The trend lines also help to pick out any anomalies in the data collection so that a clearly more accurate result can be looked at. In all three graphs there are anomalies I have circled these anomalies. This is also why I decided to use isoline maps in my project as it helps show the anomalies very clearly.
By looking at the scatter graphs we can also see a slightly different type of results between the results taken a long Broad Street and Peach Street compare to Denmark Street. In Broad Street and Peach Street the building height tends to spread out more into the Central Business District whereas with Denmark Street the change from the centre of town into the periphery of the Central business District is slightly more subtle.
All Three scatter graphs help to relate very closely back to my Seventh hypothesis:
Buildings as you move further away from the centre of town will get smaller
It is not a perfect representation of my hypothesis as there are anomalies clearly present which I have circled in the three graphs. Another fact that will lead to anomalies in my results will be that when I was taking my results I was forced to take averages for the height of the building as I had to take results from either side of the road. This again means that my results will not be completely perfect results. Other reasons for differences in building height will be affected by the cost of land along each road. Along Peach Street and Broad Street the land use is different to the land use along Denmark Street which is mainly commercial and retail land use.
Reasons for the building be higher will be that for bigger national industries such as banks and post offices found along Peach Street and Broad Street it will be easier and cheaper for them to build there buildings upwards rather than outwards. The reason where the land is more expensive is because it is the centre of the Central Business District (the core of Wokingham) and this is the area of Wokingham is at the highest demand. It is because of these premier land costs that large department stores and national chains it will be more beneficial for them to build vertically rather than horizontally. Therefore this is way the most important buildings are found in the centre of Wokingham and are higher than those less important buildings on the periphery of the Central Business District.
Description and explanation of Data Representation.
An Isoline map displaying how the height of a building is affected by distance from the town centre.
Opposite is an isoline map displaying how the height of a building on London road, Reading road and Finchampstead Road is affected as you move further away from the central business district.
By looking at the map we can see that it is based on the three roads leading out of the town centre. On each of the roads I have taken 12 points as shown in my table of data collection. As I have already described for the Scatter graph involving the building height I have taken an average of the building height along each road taking results of intervals of ever 50metres and taking a average of the building height with one building from each side.
By looking at the key you can see that the building height is represented by a different colour. Therefore each building height of 1, 2 and 3 is shown in a ring of different colour.
We can see that the outer ring of the isoline map is a ring which includes buildings of storeys of only 1 high this ring is very small as there are very little buildings which are only one storey height. From this we can draw the conclusion that the majority of buildings on the periphery are the smallest buildings. The next ring shows that the buildings increase mostly to a height of 2 storeys but a few anomalies are present. This shows very little change in height but helps to show that as you move further away from the Periphery the height of buildings begins to increase.
The next ring shows that the buildings are increase again to another level but again it is clear to see that there are some anomalies present but again the change is not changing dramatically. From this we can draw the next conclusion that as you move from the periphery of the Central Business District to the town centre the Building height increase.
At the centre this is where we see that the tallest buildings are located which is shown clearly in the isoline map therefore we can draw the conclusion that the tallest buildings are located in the town centre of the Central Business District.
This isoline map corresponds very well with my seventh hypothesis which is:
Buildings as you move further away from the centre of town will get smaller
The reason why it is not a perfect representation is the same reasons that affected the building height in the scatter graph. This is caused by the way the buildings spread out Denmark street into the Central Business District differ to that of the patterns displayed by the building height on Peach Street and Broad Street. The high cost of buildings in the centre of Wokingham will also affect the way that buildings are built. This is because big national industrial and large department stores will find it cheaper to build there buildings vertically due to the prices of land. Therefore this is way the most important buildings are found in the centre of Wokingham and are higher than those less important buildings on the periphery of the Central Business District.
Description and explanation of Data Representation.
Isoline map displaying how the amount of pedestrians vary from the centre of town to the periphery
On the next page is an isoline map which shows how the number of pedestrians varies from the centre of the Central Business District centre to the periphery of the Central Business District.
By looking at the map we can see that it is based on the three roads leading out of the town centre. On each of the roads I have taken 12 points as shown in my table of data collection. This points show the number of pedestrian to have walked past this point in a time of 2 minutes. The points where I have collected my results are situated at every 50 meters along the London, Reading and Finchampstead roads. In the map I have used a key in order to make the amount of pedestrians relate to a particle colour for the amount of pedestrians counted at its certain point.
We can see that the inner most ring shows that the greatest amount of pedestrians are present in the core of the Central Business District. This is due to the fact that this area is a pedestrianised area. Therefore I can draw the conclusion that the greatest amounts of pedestrians are present in the centre of the Central Business District.
This is the most certain conclusion that I can draw from the isoline map as there are also a lot of anomalies present in the results that I have collected for the amount of pedestrians present at the 50 metre intervals along each of the three roads. On average the isoline map show that the amount of pedestrians from the centre of the central business district to the periphery of the Central business district there is a decrease in the amount of pedestrians present. Therefore I can draw the conculsion that the amount of pedestrians decrease as you moves further away from the core of the Central Business District.
In the final ring of the map it shows the fewer amounts of pedestrians therefore I can draw the conclusion that the amount of pedestrians on the periphery of the Central Business District is where the fewer amounts of pedestrians are present.
This isoline map relates fairly closely to my first hypothesis which is
The Number of pedestrians will decrease the further you get away from the central business district
The reason why the number of pedestrians on a whole decrease as you moves further away from the town centre is because the town centre tends to dominate the commercial and cultural activity of the Central Business District. This is also where the people visiting Wokingham will come as this is where the majority of Wokingham’s commercial and retail shops are present as show in the goad map.
This is definitely the case for Wokingham as all three of its main roads which lead from other cities converged on the core of the Central Business District and lead straight through the centre of the town centre. This therefore attracts most people to the main features of the town centre.
Description and explanation of Data Representation.
Isoline map displaying how the age of a building is affected by distance from the town centre
On the next page is an isoline map displaying how the age of a building on London Road, Reading Road and Finchampstead Road varies as you move further away from the town centre.
By looking at the isoline map we can see that the map is based on the three main roads that come together in the centre of town in Wokingham these are the three roads mentioned above. On each road the same way in which I took the building height I have taken to two results at intervals of 50meters from the town hall at 12 points along each road. When I have taken the two results I will work out the average my adding them together the put that total in to one of five categories as shown in the key for my data collection which where:
A-1975
B-1950
C-1925
D-1900
E-before 1900
By looking at the key you can see that I have used the same idea to create the isoline map. Each year has been given its individual colour so that it can be easily seen to make the results to look clearer.
We can see that in the outer most ring the buildings are relatively new and have only been erected for a small number of years their ages are also very close to each other this is what I discovered when collecting my results for building age. Therefore we can say that the buildings on the periphery of the Central Business District are only a few years old and are the newest building in The Central Business District.
We can see that in the next ring the buildings become slightly older then those in the previous colour. Although they are older then the previous buildings it is not by much as they where also built to deal with the massive growth that has happen in Wokingham in the last 50 years. Therefore we can say that the buildings as you move away from the periphery become older.
This pattern of the building getter older as you move away from the periphery can be seen clearly in the isoline map with the buildings getter gradually older. Although there is a obvious move from younger buildings to older there are a number of anomalies of both much older buildings which have been left on the periphery as there have not been knocked down on renovated to newer buildings. This is also the case with newer buildings as you get closer to the centre of town this is because although it can be said that most of the old buildings survived a number have been knocked down and renovated to newer buildings. These two factors are most likely to be the cause of the anomalies. We can see that in the inner most ring of the isoline map the oldest buildings are present and are a lot older then the rest of the buildings on the map. Therefore we can say that the oldest buildings are located in the centre of the Central Business District
This isoline map corresponds very closely to my sixith hypothesis which is the following:
The buildings in the centre of Wokingham will be older than the buildings on the periphery.
The reason why building age decrease as you move away from the core of the Central Business District is because in the centre of the Central Business District is where the town started and therefore this is where the first buildings of the town where created. The town hall is the oldest building because it was the first to be built in order that the town could be set up. As it was the most important, building to be built and as time progressed more and more buildings were built around it in order to form the town. But there buildings were not all built at the same time because there was no need for them, however as time progressed there became a greater need for them and more and more buildings where needed. So therefore the oldest buildings are in the centre of the Central Business District and the newest buildings are built around the older buildings when needed.