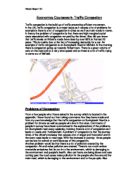
"Functions in Belfast central business district display patterns of location- clustered, random, and uniform and these can be explained".
Geography Course Work. "Functions in Belfast central business district display patterns of location- clustered, random, and uniform and these can be explained". *In a statistical sense, a random pattern results when any point can occur at any location and the positions of points have no effect on other points. Uniform patterns are characterized by each point being as far away as possible from other points. Clustered patterns indicate point patterns with various degrees of concentration. Random functions are usually specialised and are generally not as common (pet shops or jewellers). Uniform functions tend to be more common (newsagents) and as a result they tend to be spread out evenly to allow for a fair share of customers and prevent competition. Clustered functions are found close together (banks, department store), this may be for; *Convenience- less travel to select goods. *Information- swapped between businesses. *Contact- between businesses. *Comparison-customer wants to compare goods and prices. Bid rent- Given total space available in the city, the central sites are relatively few, so competition for them will be intense, and prices higher. The most central sites will be the most attractive. In our class discussion concerning or field trip in the Belfast C.B.D we chose six functions of concern to us. This would give us a mixture of Orders to allow us to

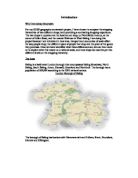
So what is it like to live in Hungary?
So what is it like to live in Hungary? Hungary is located in Central Europe and it is one of the few landlocked countries. Hungary is a fairly small country; it covers an area of 35,934 square miles, and is surrounded by the Carpathian Mountains, the Alps, and the Dinaric Alps. The Danube River divides Hungary and bisects the capital, Budapest into Buda, and Pest. The culture of Hungary is very rich and varied; it has great folk traditions producing embroideries, pottery, decorated buildings, and carvings. The religion in Hungary is Christianity, and the majority (70%) are Roman Catholic. Special traditions include believing that Santa (St. Nicolas) gives gifts on the 6th December and Jesus gives the Christmas gifts on the 24th - So I open my Christmas gifts a day early! Hungarian people also celebrate name days, each day of the calendar is dedicated to 2 or 3 names, and small gifts are given. I play the piano and am a cellist in the school orchestra; music is a very strong part in my life, and runs in the veins of the country. Hungarian music ranges from the rhapsodies of Franz Liszt to Roma and folk music. Although today's Hungary is rife with newly developed pop-bands, and modern groups, Kodály Zoltán and Bartok Béla are among the most famous Hungarian musicians who displayed the best of the Country's folk culture in their music. The characteristics of Hungarian
Overstrand report
In the past few years, Overstrand has been eroded, and people's lives, houses, schools, hotels, farmlands and the rest of the town is at risk. So we need to protect the coast from the waves, eroding the area. Action should be taken as soon as possible. Overstrand is in Norfolk close to Norwich. It is situated on the coastline, where the waves are causing lots of problems. (On the right is an image of where Overstrand is located.) Overstrand is made out of soft clay. If it was made out of hard rock or something on the lines of that, Overstrand would not have been eroded as quickly as the land has now. Overstrand has been eroded mostly by long shore drift, because the energy from the waves rushes on to the beach in the directions the wind is blowing. The waves then hit the cliff and come back down in to the sea with bits of sand and pebbles. The reason why the waves came back down in to the sea is because of gravity. This happens along the beach when it comes to a curve. Over the years the waves wash the beach away. When the beach has been washed away, the waves then start hitting the cliffs. Later on a crack will be formed, then a notch, a cave and next an arch. After the arch has been formed, it falls down in to the sea, this is called a stack. The stack will then topple over in the sea and a stump is produced. Then the stump erodes away until you
To What Extent Does the Seaside Resort of Bridlington Cater For the Needs of the Elderly People Who Have Retired To the Peaceful Seaside Resort, Also Do the Facilities Cater For Tourism That Can Be Expected?
Bridlington GCSE Coursework TO WHAT EXTENT DOES THE SEASIDE RESORT OF BRIDLINGTON CATER FOR THE NEEDS OF THE ELDERLY PEOPLE WHO HAVE RETIRED TO THE PEACEFUL SEASIDE RESORT, ALSO DO THE FACILITIES CATER FOR TOURISM THAT CAN BE EXPECTED? Introduction Site and situation, Bridlington is situated on the East coast. It is in the north of Britain. There are many neighbouring resorts offering the same features. This will mean that the resorts are always in competition. Seaside resorts have to have a wide thresh hold otherwise; most of the businesses, which are tourist orientated, will shut down. Bridlington is one of the better-situated resorts. It is in near the centre of England so it will never be too far from tourists. The main areas from which the tourists will come from are Yorkshire, Derbyshire, Leicestershire, Nottinghamshire and Humberside. Many will come from further. Bridlington is in direct competition with Scarborough and Whitby. Both are big tourist resorts. History The town of Bridlington dates back to the 11th century when it was mentioned in the 'Doomsday' Book, except then it was known as 'Bredlington'. During the last 1000 years Bridlington has been visited by several monarchs, starting with Edward II in 1319. But it is within the last century that Bridlington has become recognised as a beautiful seaside resort. Bridlington was an ideal site,
How Do the Land Use Patterns in Hebburn Compare with the Urban Models of Burgess and Hoyt?
How Do the Land Use Patterns in Hebburn Compare with the Urban Models of Burgess and Hoyt? In my coursework I will be trying to answer the question above. I will identify what the models of Burgess and Hoyt are and how useful they are in showing how towns develop. Burgess and Hoyt are land use models, which demonstrate that towns develop and grow in a pattern, with the CBD (Central Business District) as the main focal point and that towns develop and outwards from this area. Both models show land use patterns and are based on concentric circles. Burgess is the simpler of the two models; Hoyt's model is more complicated because the concentric circles intersect one another. I want to ascertain if my hometown of Hebburn fits into either of these models, to establish this I came up with a series of hypothesis, which I thought might help me to understand whether Hebburn fits into these models. Hypothesis One of the aims of my coursework is to try and answer the hypotheses that we came up with in a class discussion. * Housing density increases as you move towards the town centre * Housing age increases as you move towards the town centre * Quality of housing declines as you move towards the town centre * Quality of environment declines as you move towards the town centre * The price of housing decreases as you move towards the town centre * Traditional heavy industry
Costly congestion charges for cars.
Costly congestion charges for cars. Sophie Lakes I love my car! So sue me! Am I really the only person living in England who can hand-on-heart say that the pure convenience, comfort and care-freeness of cars makes me choose them over subways, buses and trams? No, I didn't think so. I left my office today to find a nonsensical piece of writing (that is, a parking ticket) had been carefully placed under the windscreen wiper of my innocent Renault Clio whose back wheel was just barely touching the yellow line that I had so hastily tried to avoid parking on this morning. Personally, I find it baffling. When children want an ice-cream but find that they are a few pennies short of a 99, they receive a smile and a 'I'll let you off this time'. Traffic wardens, on the other hand, have obviously never been in a hurry, have never run late and have never found themselves in a 3-mile traffic jam. It seems that traffic wardens are becoming increasingly similar to dictators, the Saddam Hussein's of the street, sadistic in their methods of monomania. Not only do car drivers, who lets face it, that's most us not brave enough to face public transport, have to pay for petrol, insurance, tax and the car itself, we now have to face fines for not just driving badly, but just, well, driving. Five weeks from now, England will see its first congestion charges, £5 a day for car drivers to

A Study of Gloucester's CBD.
A Study Gloucester's CBD Gloucester is city in the south west of England, situated on the River Severn. Located 114miles from London and nestled between the Malvern & Cotswold Hills. Above: Map of central Gloucester. The aim of this project was to carry out an urban study, test hypothesis using a range of fieldwork techniques and to work in pairs or small groups. Hypothesis were set before the project began, these were: * The CBD of Gloucester is greater than 1/2 mile in diameter. * The highest pedestrian counts would be in the CBD. * Food services in Gloucester are clustered. * Environmental quality is highest around the outskirts of the CBD. Data Collection Method Relevance to Study Land use Transect * Each pair is to be given a transect extending out from the CBD of Gloucester * Every 30 paces the building must be recorded * Use of buildings, number of storeys & any roads crossed has to be shown. * This was a systematic sample * Helps to determine land use. * Shows where CBD typically ends * Each pair worked out where CBD ended on transect [cut off point], using bid rent theory * This information was collaborated onto a class map, where the CBD was shown & shaded in. Pedestrian Count * Each pair is to be given 2 grid squares situated in or around Gloucester's CBD. * At 12 & 12.15 stand in the centre of each square * Count the number of people
Compare the shopping hierarchies of two different shops, both providing a contrasting shopping experience. The two shops in question are the local corner shop, on Northfields Avenue, at the corner of Julien Road, and the nearest Waitrose in West Ealing.
Introduction Why I am doing this project For my GCSE geography coursework project, I have chosen to compare the shopping hierarchies of two different shops, both providing a contrasting shopping experience. The two shops in question are the local corner shop, on Northfields Avenue, at the corner of Julien Road, and the nearest Waitrose in West Ealing. I am doing this project because I am interested in how area, transport and economies of scale affect the way people shop; the different types of people that shop and the price of the goods they purchase. Once we have identified what these differences are, we can then move on to explain what this means on a national scale, and how shops can each be put into different levels on the shopping hierarchy. The Area Ealing is a leafy west London borough that encompasses Ealing Broadway, North Ealing, South Ealing, Acton, Hanwell, Greenford and Northholt. The borough has a population of 300,984 according to the 2001 national census. London Borough of Ealing The borough of Ealing has borders with Hammersmith and Fulham, Brent, Hounslow, Harrow and Hillingdon. London Boroughs Map The two shops I have chosen for my GCSE Geography project are both situated in the borough of Ealing. The first, Waitrose, a major supermarket is located in West Ealing near the West Ealing mainline train station. This line goes to Ealing Broadway and on
Geography Introduction - Traffic on routes leading into Birmingham
Introduction Birmingham is the second largest city in the whole of England therefore; it is a possibility that there will be a great deal of congestion of routes leading in and out of the city centre. Our investigation consists of four main aims, which my group intended to achieve. These aims will help me to establish whether my hypothesis is correct. * Firstly, I must find out whether traffic congestion does occur on routes leading into Birmingham. * Our next aim is to verify what the main source for causing the traffic congestion is. * Also I am required to assemble the evidence and interpret the data collected through my method and put into action. * Lastly, I will distinguish methods that could possibly reduce congestion throughout Birmingham. There are many reasons why people travel to Birmingham and some of these reasons are the main causes of traffic congestion on routes leading into Birmingham. Some of the reasons are: * Shopping * Tourism * Business/Work For all of these reasons there is a large variance in the Sphere of Influence as supplementary amounts of people travel to Birmingham as Commuters or tourists. Shopping:- Due to the recent development of the new Bullring Shopping Centre, many people will be willing to travel to shop within the 110,000 sq m of retail space and with over 140 shops within the centre, it is no reason it is one of the

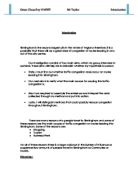
To investigate downstream changes in Loughton Brook
GEOGRAPHY COURSEWORK: "To investigate downstream changes in Loughton Brook" Introduction For this coursework I will investigate the downstream changes in Loughton Brook ? Figure 1 Location of Epping Forest within the UK Map of the UK....showing roughly where it is ? Figure 2 Location of Loughton Brook within Epping Forest Loughton Brook is located in Epping Forest, an area of woodland in south-east England. Formed in approximately 8000BC after the last ice age, it covers 6,300 acres (approx. 24km²). Epping Forest contains areas of grassland, rivers, heath, ponds and bogs. It is approximately 18km long by 4km wide, but is considerably narrower in most places. The forest lies on a ridge between the valleys of the river Lea and Roding. It is on a watershed separating two drainage basins. The age of the forest and the range of habitats it contains make it a valuable area for wild life and it is designated as a Site of Special Scientific Interest. This meaning an area identified by English Nature or Countryside Council for Wales for protection by reason of the rarity of its nature conservation or wildlife features. Due to soil and relief, historically Epping Forest has been unsuitable for agriculture. The land is mainly used for research and recreational purposes e.g. mountain biking. The rocks and soil of Epping include pebble gravel, bang shot beds, clay gate beds and