Analysis
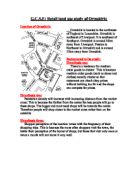
Land Use Classification Map
The land use classification maps for Blackpool shows that the most number of high order shops are in the centre of Blackpool. This links to the rates, as towards the centre the rates should increase, as it is a more prestigious location. As the hypothesis states it is a characteristic of CBD’s to have lots of high order shops and medium order shops and few low order shops. The position of the high order shops are linked to the pedestrian density map as more people will want to visit the areas with high order shops so the density will be higher there. I predicted that in Blackpool the specialist shops will be in the centre of the town CBD but quite a lot of the specialist shops were in the frame, the tattoo salon for example. Also the shopping and environmental quality is linked to this, as the high order shops tends to be in areas with higher shopping and environmental quality values. The land use classification map of Lytham shows that there is a mixture of low, medium and high order centre which according to my hypothesis is a characteristic of a small town. This as with the Blackpool land use map is also linked to the pedestrian counts and the shopping and environmental quality values as the highest pedestrian density tends to be in the areas with high order shops as these are the best shops in the centre.
Shop Breakdown
As fig S1 shows, the highest percentage of high order shop for Blackpool are in the centre and south zones. This is linked to the pedestrian and shopping and environmental quality scores, as the highest of these scores are in the centre and south zones. The north and east zones have the highest percentage of vacant shops which also links to the shopping and environmental score because if there aren’t any shops there the shopping quality score will be low. If the environmental quality is low, businesses will less likely want to purchase property so they will remain vacant. This is also linked to the pedestrian density as if there aren’t many shops there they will not shop there. All of the zones have roughly the same percentage of medium order services. This is because Blackpool is a medium to high order centre and the medium order shops are likely to be in any area as they get make more profit as they are medium order services so can afford better locations. Also more national businesses are medium and high order so can afford sites in the centre, whilst independent businesses may only be able to afford smaller sites in the frame of the CBD. This is linked to rates, (see fig B3 and analysis of it). As fig S2 shows Lytham has roughly the same percentage of high and medium order shops which was not what I predicted in my hypothesis but has a higher percentage of low order shops than Blackpool which I predicted in my hypothesis. I predicted that the low order centres would more convenience stores than a high order centre, which is correct in this study but I also predicted that the higher centre would have a higher percentage of specialist shops which it didn’t as they both had similar percentages. Blackpool has a higher percentage of vacant shops than Lytham. This could be because there are 7 times as many shops in Blackpool as there are in Lytham so there may be a lower demand for them if they are in the frame of Blackpool CBD. As figs S3 and S4 show Blackpool has more variety of shops due to its size but similar percentages of clothes shops, cafes and electronic shops. Lytham has a higher percentage of gift shops and restaurant. This could be because people travel to Lytham, as it is a quiet seaside town and they then eat at the restaurants and buy gifts at the gift shops. As graphs S3 and S4 show the radius of the pie charts are directly proportional to the square root of the number of services.