Date – Wednesday 3rd August. Time – 2.30pm-2.45pm
Weather – Hot and Sunny
Date – Saturday 20th August. Time – 12.00noon-12.15pm.
Weather – Sunny but very windy.
Date – Thursday 25th August. Time – 2.30pm-2.45pm
Weather – Rainy.
I took the survey all three of the times I visited the site, as to compare the difference in visitor numbers on different days and in different weather conditions.
Car Park count.
I decided to survey the number and percentage of cars in the car park at different times of day, and on different days and in different weather conditions, so as to acquire an even spread of data on the popularity of Sandymouth as a honey pot site. Here are the results:
Wednesday 3rd Wednesday 3rd
Time – 10.30 Time – 2.30
No. of vehicles – 120 No. of vehicles - 198
% full – 60 % full – 99
Saturday 20th Saturday 20th
Time – 10.30 Time – 2.30
No. of vehicles – 100 No. of vehicles - 150
% full – 650 % full – 75
Thursday 25th Thursday 25th
Time – 10.30 Time – 2.30
No. of vehicles – 31 No. of vehicles - 39
% full – 15.5 % full – 19
I decided to take the survey twice in one day, in the morning and in the afternoon, so as to find out which times of day are more popular than others. The results show that the site was busier in the afternoon.
People count
I decided to take a survey of the number of people passing a specific spot at different times of day. The survey was taken outside the Sandymouth café every time. Here are the results:
Wednesday 3rd Wednesday 3rd
Time –10.00am-10.15am Time – 2.00pm-2.15pm
No. of People – 89 No. of People - 108
Saturday 20th Saturday 20th
Time –10.00am-10.15am Time – 2.00pm-2.15pm
No. of People – 82 No. of People - 92
Thursday 25th Thursday 25th
Time –10.00am-10.15am Time – 2.00pm-2.15pm
No. of People – 34 No. of People - 41
I collected the data once again in the morning and the afternoon, to acquire an even spread. The results show that the site was busier in the afternoon, and on sunny days.
What visitor facilities can be found at Sandymouth?
Here is a list of the type and number of visitor facilities at Sandymouth:
I decided to collect this data to find out what facilities are available for visitors to use. This may give me a clearer answer as to why Sandymouth is a honey pot site, what is being done to manage the area and the efforts the national trust are putting in to keep Sandymouth a honey pot site.
Is there any evidence of visitors damaging the environment?
Litter survey of Sandymouth
To find out if there is any evidence of visitors damaging the environment, I decided to carry out a litter survey of the two most popular areas of Sandymouth – the beach and the area outside the café.
As the national trust cannot afford refuse collection, and therefore being no litter bins on Sandymouth, I expect there to be quite a lot of litter lying around. Visitors are kindly asked to take their litter home, but they do not always read the signs. Here are my results:
This evidence shows us that there is litter on Sandymouth, and there is definitely evidence of damage.
Footpath erosion survey
I decided also to carry out a footpath erosion survey of Sandymouth. I started at the start of the chosen location, and proceeded to take a note of the level of erosion every twenty steps. Here are my results:
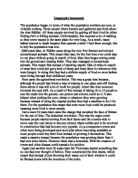
This evidence shows us that the most eroded places are where the visitors cluster at points such as gates, stiles, bridges or places where the views are best. From the evidence shown in location C, visitors seem to stop and dig their feet into the ground where the ground changes angle and gets steeper as they get tired. They stop to rest at these points. These points are called nodes, and are shown in the table above.
Also, I noticed when I returned to the site on the rainy day, the visitors seemed to have walked around the muddy patches where erosion had already taken place, therefore creating further erosion and widening the path.
Vegetation survey
Here is a survey I decided to take to evaluate the distribution and frequency of plants in different areas. I took a quadrat frame, where every square represents 1% of the total area, and recorded the name of the plant.
Key
Sg – Short Grass
C - Clover
R – Rib Wart
T – Tansy
Key
C – Clover
M – Meadow grass
-Blank spaces stand for SHORT grass-
Key
C – Clover
M – Meadow grass
-Blank spaces stand for LONG grass-
This is the first set of data regarding the vegetation survey. It shows that just off the main path there is mainly clover and short grass. There is some tansy and rib wart distributed fairly event around the quadrat frame.
On the main path there is mainly trampled short grass, which is understandable on account of that is where everybody walks. However, when I revisited the site for the second time, I noticed that a lot of the short grass had died as the summer had gone on, and on the rainy day, a lot of the grass just off the main path had died as well.
What attempts are being made to manage the area?
At Sandymouth we can see evidence of the national trust’s efforts to protect and manage the paths, beaches, and overall the visitor’s happiness. They have so far:
- Signposted the area so visitors can access the area easily and navigate if they don’t know their way around.
- Laid tarmac on the road incoming to Sandymouth, so it is easy and comfortable to drive along, and doesn’t create dust.
- Gravelled the car park and overspill car parks to give cars a better grip and to prevent dust flying up.
- Built a wall at the end of the car park to act as a visual barrier, so the visitors on the beach don’t have to look at the cars. This wall also prevents further erosion of the road by stopping cars over swinging the corners.
- Allowed the area of scrub to the left of the car park to grow tall, stopping visitors sitting there, and to give the area a more natural look.
- Put up signposts along the footpaths to guide visitors, that have maps and arrows to point them in the right direction.
- Protected an area of footpath that had been extensively damaged, by closing it off and laying Hessian matting down over the damaged grass so as to allow it to grow through.
- Provided an alternative route to the damaged one, and put up a sign telling visitors why they have blocked off the existing path and telling them where the new one is.
- Gravelled the path leading down to the beach so that it becomes easier to walk down, and provides ease of access for disabled visitors.
- Laid granite bars at intervals along the path leading down to the beach to prevent slippage of the downhill path.
- Put up a health and safety sign by the beach to warn visitors of the dangers of the sea, cliffs and various diseases.
- Put up posts at the top of the gavelled path to stop cars driving down there and disrupting the visitors. They have completely isolated the car park from the rest of the site, without putting up any major physical barriers.
- Reinforced and widened the existing bridge to prevent further erosion, and reinforced the stream bank.
Clustering survey
I decided to record a clustering survey of Sandymouth to try and find out why Sandymouth is a honey pot site and whether clustering has an influence on erosion.
Clustering basically means where groups of people congregate to sit and admire the view. This may seem harmless, but, however, if the visitors drop litter around these areas, or somehow kick up the turf, they are damaging the area and causing problems for not only the other visitors, but the national trust.
The results of this survey are shown on the attached map.
They show that people cluster around the grass outside of the café, on the edge of the cliffs on both the right hand valley side and the left hand side, around the bench on the footpath on the valley side, around the picnic benches and at the gates.