Paint could also be possible software to use as it is good organising pictures and manipulating images. Nevertheless paint is very hard software to use and does not let you use features such as doing hyperlinks to online sites and is therefore not fit for purpose. Taking in to account that not only could you possibly use electronic solutions but you can possibly use a manual solution. In this case a manual solution would not be able to supply enough information in the PowerPoint as you cannot do hyperlinks and use videos and music in it. Electronic solution are the best way to go about the solution in hand as electronic solutions can be created easily and used easily. Electronic software to solve the solution can also store information and maybe update the presentation.
As I am going to be using be using PowerPoint I will be including features such as making hyperlinks from the presentation to a website to find out more information. For example making a hyperlink to the online website for Odeon to see what time viewing times are, this gives much more available information for the user to use. Furthermore I will be using video to show graphic information to help people by including a video of the church choir for people to find more information about the church choir and the town hall. Also I will use sound features and using tables and graphs. Tables and graphs are very helpful as it used to show people which attractions are the best to go to. All these features help solve the multi media problem. I will be using action buttons to make the presentation interactive and for the user to be able to go back to the main page in order to get specific information which the user wants fast and easy. Action buttons are very important in a presentation so the user can go back and forward of the PowerPoint to find information and this also help solve the problem by finding fast information. In the presentation I will be able to manipulate graphics which I will include in the presentation by including a manipulated map of the Chelmsford city. As well as extended features which can be use I will also be able o write up general information and making background colours. Using all these features will make my presentation fit for purpose as it gives the availability for people to find specific information and fast. The features will allow the presentation full of all varies of information and make the presentation interesting.
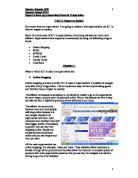
My guide presentation has to include:
- general information for the people to find out about Chelmsford
- hyperlinks to web pages and have pictures
- an action button that gets the user back to the homepage so users can get specific information fast
- a manipulated map showing Chelmsford edited with arrows and highlighted areas
- Music and videos in the presentation
- Tables and graphs.
Analyse
Within this section I will be investigating what new hardware and software is needed to be supplied by the council.
Hardware
In order to create and use the presentation hardware will need to be required. This hardware will include the hardware needed to require and manipulate data which will be used in the presentation also the hardware needed for the use of the presentation for example computers or speakers for the presentation to be viewable and operational.
My computers which will be used will be simple as the computers only have o be suitable to run the basic presentation and has internet access. The computers used do not need a high specification as the computers will only be used for accessing and viewing the PowerPoint presentation.
My computers which people will view the presentation on will be stand alone computers. My recommendation would be to buy a system such as a Packard bell imedia 2218. This system hardware has a 160 GB hard drive. This particular system is a desktop personal computer and including in the package is an 18.5 inch monitor suitable for the viewing of the presentation. The stand alone computers will not need to have any internet access as the presentation is on a stand alone computer.
Furthermore as a backup alternative output for the presentation on the computer I recommend buying a projector which can then project the presentation on to the wall. A suggested model would be an ACER K10 business projector.
Speakers are also required for the sound and videos in the presentation to be able to be heard by the viewer of he presentation. These speakers should be used on all the computers and should also be used for alternative output purposes such as when the presentation is shown through the projector.
A USB is also required for the security of the presentation to be backed up and stored.
For each of the youth sites were the computers will be accessible a printer will also be required. This will be another alternative output for the presentation to be shown. This will allow the presentation to be printed of. This will also allow people to print off information from the presentation as people may want to carry specific information for reference purposes. For example printing the map of Chelmsford and handing the map out to people. The printers which will be used once again do not have to be very expensive. I recommend for a printer such as the hpd1660 printer to be required as it is a relatively low cost as all what’s needed is for it to be able to print, so therefore does not need a high specification.
Additional hardware also includes :- a sound recorder to use for the initial presentation and to use for future updates. Additionally a digital camera and a video camera are required. These will be used when the presentation needs to be updated such as the videos or pictures and for self taking videos and pictures required for the presentation.
Software
The software that I have identified that is required is PowerPoint, Paint and Excel. These packages usually come as part of a suite of packages within Microsoft office and are fit for purpose. This is will have to be adaptable to Microsoft vista which is the operator.
PowerPoint will be used in creating and using the presentation. Excel is a software which is going to be used for the graph which is going to be put into the presentation. Paint will also be used for the manipulation of data which will be used in the presentation.
A anti virus software will also need to be required. I would recommend the Norton antivirus software able to protect the computers which will be needed.
Data required
In my presentation I will be using a map of Chelmsford showing where all the attractions are. This map will be supplied by the tourist office which will be used to find whereabouts you are at the moment and can be used to navigate through the town of Chelmsford. The map will also show where all the main attractions are located and where to go to visit.
To check any errors with the map it will need to be compared to maps from other sources to confirm it is correct and the most up to date version. Also it may be important for somebody to double check some of the information the map for example by checking various locations in the town for themselves. One example would be if a shop that had closed down such as Woolworth’s (recently closed) that was on the map version.
I will also be using in the presentation the logo of the Essex County, this will be required by the graphics editor of Chelmsford council John Macdonald
I will also be using links to other websites in the presentation. This will allow users to get more information for items that they are particularly interested in. One link to a website which I will use will be a link to the Chelmsford Odeon website. I will find the Odeon website by searching on Google for the website to Odeon. This website will be used for people who want to find out more about the cinema and specifically what is showing and when and the actual viewing times of films. To check that this website was the official Odeon website would be to ringing Odeon and checking with them whether the website is correct.
I will be using a video clip in the presentation of the children in the cathedral of Chelmsford singing. To require this I am going to be contacting the sound editor of Chelmsford cathedral Matt Davis who is then going to supply me with the sound of children singing in the cathedral and manipulate it to my presentations needs. The video will then be used for the people who want to get an insight of what the cathedral is like. Any errors will be checked by comparing other videos of the cathedral or by going to the cathedral and seeing if the data is correct. You could also compare the video with other ones.
Sound of a trial taking place will also be included in the presentation to give. I will require this from the sound editor of the Chelmsford crown court David Simons, to check for errors in the sound of the trial the sound will be listened to and David Simons will insure that it is correct.
Other pictures that will be put into the presentation most of these are pictures of places of Chelmsford and attractions. These pictures will come from the graphics editor of the Chelmsford council John Macdonald. As most of these pictures are of the Chelmsford places you could check the city to see for yourself if the pictures are correct or maybe by comparing the pictures with others. Also some various pictures will be self taken via digital camera.
Graphs and tables of how popular an attraction is will come from a survey. This will be completed by the Chelmsford council and will compare various attractions to previous surveys completed previously within Chelmsford. I will contact the Chelmsford council to request certain statistics and figures which I will use to update the graphs and stats which are needed to go into my presentation.
To check any errors with the data you could compare the tables and graphs with other ones to see if the stats and figures are correct and reliable and complete a sanity check on the information to ensure that nothing stands out as being odd.
Some information shown in the presentation will be required from the Chelmsford council archives. This information will be of general information of Chelmsford, history of the area, Information telling the reader what attractions can be visited in the Chelmsford area and what they are. Also information about the town hall will come from the council archives.
Data Manipulation
The following table illustrates for each slide, the data input, how the data will be manipulated and then how the data will be displayed in the output in the presentation and how the data could be displayed differently as an alternative.
Data Flow
The data flow diagram on the following page shows the potential manipulated changes required in putting the presentation together and how it is going to be shown in the presentation and the flow of data.
Security and Back up
In order to maintain security within the presentation, the presentation will read only. This will prevent anyone tampering with the presentation and stops people from manipulating the data installed in the PowerPoint presentation on each of the computers in the public place where they are held. To ensure that the presentation is read access only the presentation will be password protected. A limited number of people will know the password so they can update the presentation.
The data will be backed up weekly, as the data in the presentation will be updated once a week. The data will be backed up on a disc, also the new updated data will be sent to a main computer where it will also be saved. The disc will be stored in a safe in a different location from the main computer in case of theft or a fire. The security will be maintained as the disc will be kept in a safe. If in the event the original data was lost or corrupted the data could then be easily restored from the computer the data was sent to or the disc.
This is very important for the data to be secure in order to prevent anyone altering the data of the presentation. It is also especially important for the data to be backed up as in the case that the security is breached and the data maybe altered then the data is backed up from the disc or the main computer.
Analyse - New page
Software & Hardware required
What software and hardware does the company need to invest in that will help solve their problem? Remember you are the computer expert and you are recommending what type of computer software & hardware they will need. Also consider what they already own.
Consider if they need a camera, a graphics package, a scanner, a good sized monitor? Why would they need these?
Data Required
All the information is needed, i.e. maps, the authors background, links to websites, video clips or photographs. Where will this come from and how will it be used and for what? How will errors be checked.
Data Manipulation
This is data or graphics that you have collected and then changed it before adding it to your presentation
Data flow
How does the data flow through your system? Refer back to your users’ problem. You could use a diagram to display this.
Format of information
How many slides will there be, what will be on each slide, buttons, graphics, logos, colours, home page buttons/help buttons, transitions, text – headings, colours, font sizes. Where will these be located on each slide? Remember slides need to be fit for purpose! Refer back to your users’ problem.
Output
What will be screen based and what will be printed out?
Alternative outputs – Sound or a printer? Refer back to your users’ problem.
Security
What Backup & Security will they need? How will they do this? How often? Why is this important? Where will these backup copies be kept, how will security be maintained. If the computer is kept in a public place, how will you ensure its safety? Why is it important to keep passwords secret?
Design – New page
Initial Designs
Proposed designs – neatly HAND DRAWN – use rulers, coloured pencils etc
You need to show basic details including colours, fonts, font types, where there are action buttons/links etc. Drawings must give an indication of the design and theme of the slides, where the links will be and proposed colours themes.
End User feed back
Feedback from your user of exactly what they want changed on your initial designs. You need at least 2 changes per slide i.e. Does not want a red colour theme, would like it to be blue. Need to discuss the problem & how user might what to view the slides. I.e. needs to be clear and text must be easy to read.
Menu structure
This must start with the home/start page/title page which your user can return to at any time, which links to where?
Final Designs
These must look like your actual slides!
Slide designs again HAND DRAWN on a whole page, use rulers, coloured pencils etc
Title each page ‘Final designs’ and make sure you have your name and ICT group on each sheet.
This shows what your user wanted changed. I.e. there is a blue colour theme blue when it used to be a red theme.
You need to show all details including colours, fonts, font types, where do all the links go to, what pictures/maps/photos there are, how the logo was created, content of the text – lots of detail – enough detail so that somebody could create your slides from these drawings.
Animation & transition effects
Discuss which slides will have animation and transition effects and what they are called.
Breakdown of sub-tasks
Extension only – This is a break down of everything you need to do to complete your slides and what tools you need to use (camera, download maps, add transitions etc), don’t forget to add the testing and correction of any errors!
Test Plan
Test plan (about 10-12 tests)
Intended tests need to be constructive; tests need to be linked to your quantitative objectives on your first page of the project. You need to mark these tests with a *. Identify which tests will test their problem?
Create and carry out a test plan for your project, e.g.:
Example only – do NOT use
* Linked to my quantitative objectives
Implementation - New page
Screen shots of all your slides and how it works and what you have done to solve the user’s problem. You need to make sure that it’s the same as your FINAL DESIGN drawings.
Extension: Any changes need to be discussed on how the project was developed; discuss any errors and changes that you had to make that are different from the final drawings. Also add what do you think could be added or improved.
Show all your slides. You must evidence how the problem has been solved.
Testing
Test plan & screen shots - copy your test plan into the first 3 columns. You need to show before & after screen shots of your tests. Have at least 1 test that fails and then show what you did to correct it. You must also evidence the problem being tested.
You need to screen shot all your testing showing a before and after screen shot. Label each test, test 1, test 2 and so on with the before and after screen shots below each test.
Evaluate – New page
Evaluation of initial objectives & have these been met and how do they solve your users problem?
Use these headings
Project strengths (2) – how it solves your user’s problem
Project weaknesses (2)
User feedback – this could be a letter from your user or a questionnaire, saying how your slides have solved their problem, comments should be critical and relevant and what they can now do, now that the problem has been solved.
The user’s feedback should lead further into identifying further enhancements to your slides
Further ideas for improvement (you need 1) – These must be linked to improvements that your user has suggested and some of your own.
What you would do if you were to design your slides again?
How would you achieve this?