=SUM(x+y+z)
(Where x, y and z are all cells)
OR
=SUM(x:y)
(Where x:y is a range of cells)
NOTE: In this case, no multiplication needs to done, so this does not need to be explained.
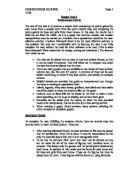
- This is how I plan to layout the spreadsheet, and how I plan to add formulae to create the appropriate figures for the chart. This is only a plan of the layout, and the specific cells used may have to be changed. This will therefore result in the formulae changing accordingly.
- When this has been done, the number of points will be shown in the cells, not the formulae. To display the formulae, click on Tools>Options, then tick the box next to ‘formula’. This can, obviously be reversed by removing the tick from the box
-
After completing this, the data as been arranged in suitable way to be used for the chart. To commence creating the chart, select the icon from the toolbar. This will bring up a wizard, which must be completed correctly for the graph to fulfil all the criteria.
- This wizard has only four steps:
- The first step is used to choose the appropriate graph for this task. A ‘column graph’ is the correct type of chart for this task. This is already selected on the menu. As to what specific graph is required, I believe that a ’stacked column’ graph is the best, as it can display totals, and what percentages make up that total. This is the middle graph on the top row. This can simply be selected by clicking on it. Click next to proceed to the next stage.
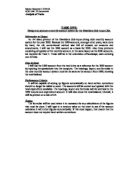
- This second step is to choose the range of data to be used for the graph. Next to the ‘data range’ box, there is an arrow. Click this, and a selector will come up over the spreadsheet. If using the identical configuration as above, then the data from A16 to E17 must be selected. This has been highlighted in pink on the above diagram. There is an option to display the data in ‘rows’ or ‘columns’; ‘rows’ should be selected. Continue by selecting the ‘series’ tab at the top of the wizard. This allows further ranges to be put as names etc. Click on the arrow next to the ‘category x-axis’ box, and selected the range B14 to E14. This is assuming the same configuration is used. This has been highlighted in orange above. Click next to continue.
-
This stage is used to add titles, labels etc. On the first tab, add the title: ”A chart showing the points gained by the houses, and the respective points gained by boys and girls in last year’s 100m.” In the box underneath, the x-axis box, “HOUSE” should be entered, and “POINTS AWARDED” should be entered into the y-axis box. There are also tabs called “axes”, “gridlines,” ”legend,” and “data labels”. Nothing needs to be changed in these, as the default settings are correct. However, select the “data table” tab, as I believe that a data table should be added. Add a tick in the ‘show data table’ box, and then check that there is a tick in the ‘show legend keys’ box. Continue to the final stage.
- This stage is not vital to the success of the task. Choose the top option, placing the chart on a separate page. This is simply easier to use and to display. The chart has now been created.
- Whilst viewing the chart, I believe that the zoom must be changed to 67%, as this allows the best view of the entire chart. To do this, simply click on View>Zoom>Custom, and enter 67.
- From this stage, the aesthetics of the chart can be changed. These are the things such as the colours, text sizes and proportions of the chart. By right clicking on a space on the page, a menu is brought down which allows you to change any options that you have entered into the wizard. Otherwise certain other things can easily be changed:
- To change the font of any text, simply select the box around it, and choose the new font and size from the toolbar
- For any other thing that you wish to change, such as the bar size/colour, gridlines, legend, data table or to configure the axes, double-click on them, this will bring up a menu from which they can be altered. When everything has been altered to a satisfactory standard, and the chart looks aesthetically pleasing, it can then be printed.
SATISFYING THE PERFORMANCE CRITERIA
In the analysis, there are several performance criteria stated that must to be followed for the task to be a success. These are the things that I plan to do to fulfil the tasks:
-
In the analysis, it states that: “the title must be clearly displayed.” To ensure that this is case, I shall use Times New Roman for the font. The reason for this is that it is the most unambiguous and easiest to read, hence the title will be clearly displayed. It shall also be made size 20. The reason for this is so that it is large enough to read from a distance, yet not too big that it takes up too much space. It shall be written in capital letters, bold and underlined to help it stand out further. I believe that further to this, all of the other text on the page should also stand out and be recognisable. For this reason, all of the text is either Times New Roman or Arial. I have used two different fonts to avoid repetition. The text on the two axes will be in Times New Roman 14, and will also be written in capital letters. The legend will be in Arial 14 bold, and the text in the Data Table will be in Times New Roman 12 bold. I also plan to enter my name in the corner of the page. I shall keep it quite small, Arial size 10 bold. To avoid confusion, but maybe at the expense of style, I shall make all of the text on the page black. This means it will stand out further.
- It also states that the chart must illustrate points for each house, and the points for boys and girls in each house. To access whether this has been fulfilled, I can only look at the appearance of the graph. However, I believe that by using a stacked column chart this will have been fulfilled.
- The analysis states that the point for boys and girls should be in different colours. I shall leave them in the colours that are given by the computer, to avoid complication. These colours are ‘plum’ for boys and ‘periwinkle’ for girls.
- To check whether all houses are present, I shall check that there are four bars on the graph., and that no bar has been repeated. This is then sufficient proof that this section of the analysis is fulfilled.
- The x and y axes need to be labelled with ‘house’ and ‘points awarded’ respectively. This will be done using the wizard, see above.
- There must also be a key to the chart. This will also be entered using the wizard. This should also include a small box of the same colour as the graph section that it depicts. This can all be done through the wizard, as explained on a previous page.
- As this graph is to go on display in Holly Grove High School, it should be attractive, but also easy to look at from a distance. It is for this reason that I have made the text as large as can be fitted onto the page. In accordance with this, I have also tried to make the graph as large as possible, without it impinging onto the title. For this reason, I have changed the range on the y-axis from 0-100 to 0-90. This minimises wasted space.
-
A sketch has been provided on an attached sheet. This is an annotated overall view of what the chart will look like when printed out. NOTE: The bars are not to the correct proportions, but are drawn simply to replicate how the printout will appear.
TESTING PLAN
To test whether this task has been performed in a correct manner, I need to ascertain whether the figures used for the chart are correct, and whether they have been used correctly to give accurately sized bars.
To test the task, I shall perform the addition of the points mentally, and then plot these points onto a graph. This graph will again be done by hand, allowing for no computer errors. I will then compare the two graphs, the manually produce one and my final printout. It the proportions are identical, I can assume that I have completed this task successfully. This comparison will be done in the testing section of the task.
From quickly finding the appropriate figures from those given to me on disk, I believe that these are the sums that I need to perform to gain the figures with which to test my task:
AUSTEN
Boys:
= 5+13+13+9
Girls:
= 15+13+3+3
BRONTE
Boys:
= 9+12+9+12
Girls:
= 11+9+10+15
DICKENS
Boys:
= 11+5+5+7
Girls:
= 5+11+11+9
GREENE
Boys:
= 11+6+9+8
Girls:
= 5+3+12+9