Maths Coursework
Foundation Tier Task – Aunt Lucy
Plan
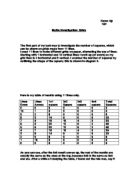
My plan is to calculate all four schemes in three five-year periods. Scheme A, B, C and D each last for 15 years. I will set the results using tables of data. Then I shall produce bar graphs to compare my results and evaluate what I have done.
The schemes are as follows: -
Scheme A
£100 to pay now, £90 to pay in a year’s time, £80 to pay in two year’s time, ect
Scheme B
£10 to pay now, £20 to pay in a year’s time, £30 to pay in two years time, ect
Scheme C
£10 to pay now, 1.5 of £10 to pay in a year’s time, 1.5 of £10 to pay in two years time, ect
Scheme D
£1 to pay now, £2 to pay in a year’s time, £4 to pay in two years time, ect
Prediction
I predict that Scheme C will have the highest income after the 15-year period. The other three schemes I predict will go in the following order: - Scheme B, Scheme D and Scheme A. Scheme making the least money and Scheme C making the most.