The totient function.
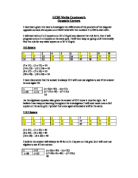
Maths Coursework The totient function ?(n), also called Euler's totient function, is defined as the number of positive integers <= n which are relatively prime to (i.e., do not contain any factor in common with) n, where 1 is counted as being relatively prime to all numbers. Since a number less than or equal to and relatively prime to a given number is called a totative, the totient function ? (n) can be simply defined as the number of totatives of n. For example, there are eight totatives of 24 (1, 5, 7, 11, 13, 17, 19, and 23), so ?24=8. The totient function is implemented in Mathematics as EulerPhi [n]. In this part of the coursework will be investigating the phi function of: ) ?(p) 2) ?(m x n) = ?(m) x ?(n) 3) ?(pn) 4) Other methods of calculating the Phi values of an integer that I found from the net. Find the value of: (i) ?(3): = 2 3 = 1,2 The number 3 only has 2 positive co-prime integers they are the numbers 1 and 2. (ii) ?(8): = 4 8 = 1,3,5,7 There are 4 positive co-prime integers for the number 8 (iii) ?(11): = 10 1 = 1,2,3,4,5,6,7,8,9,10 The number 11 has 10 positive co-prime integers, and they are shown above. (iv) ?(24): = 8 24 = 1,5,7,11,13,17,19,23 The number 24 has 8 positive co-prime integers, and they are shown above. Part 1 In this part I will try to investigate on ?(n). But before we can start we need to experiment on certain numbers.

I chose to do my coursework on investigating different aspects of different newspapers.
Maths coursework I chose to do my coursework on investigating different aspects of different newspapers. I have several newspapers at home because my dad, granddad and grandma read different newspapers, since I want to start reading and do not know which one to choose, I am going to investigate which newspaper would be suitable for me by investigating the following factors. . which newspaper have more adverts 2. which newspaper tend to use pictures to express its idea more than using words 3. the readability of each newspaper 4. which newspaper will have more articles on sport, or more articles on business etc. I did a questionnaire before I actually did my investigation and I noticed that the tabloids newspaper is more popular. I think this is because it tends to use a more exaggerate approach when reporting articles, using big, informational pictures on it's front page to attract readers to buy it. I would expect the broadsheet newspaper or the quality to have the most readability because most of the readers of this paper are more elderly and would prefer reading than just looking at pictures. The tabloids should have more articles on sport than on business because they again use big pictures and a short paragraph to report a sport result while a quality or broadsheet newspaper would just use a normal sized picture with a long paragraph. Also, during the questionnaire,

I chose to research the effects of social facilitation because I've always wondered how and why the presence of people can affect your performance when carrying out tasks especially in the area of sports.
Background I chose to research the effects of social facilitation because I've always wondered how and why the presence of people can affect your performance when carrying out tasks especially in the area of sports. Social facilitation is a term used for the presence of others can increase arousal and therefore enhance dominant responses. Previous Research Floyd Allport, Participants were asked to write down as many associations as they could think of for words printed on the top of an otherwise blank piece of paper, (e.g. "building", ""laboratory") They were allowed to work for three one minute periods and performed alone and in front of two other persons. Results were quite clear : 93% of the participants produced more associations when working in the presence of others than working alone. Zajonc's drive theory of social facilitation. As we have seen the presence of others, especially when they are paying close attention to out performance as an interested audience, does seem to increase the feelings of arousal. Zajonc put forward a theory to explain this: First the arousal increases dominant responses. Second is the response can either be correct or incorrect. Also if it is found that the people are skilled in the task they will perform better than people less skilled. In his study people were asked to pronounce words between one and sixteen times, some of the words

Opposite Corners
Louis Franks 10PC 10X2 10/12/01 Opposite Corners Wx L Difference Increase Wx L Difference Increase 2 x 3 20 0 6 x 3 00 50 2 x 4 30 0 6 x 4 50 50 2 x 5 40 0 6 x 5 200 50 2 x 6 50 0 6 x 6 250 50 2 x 7 60 0 6 x 7 300 50 2 x 8 70 0 6 x 8 350 50 2 x 9 80 0 6 x 9 400 50 2 x 10 90 0 6 x 10 450 50 We are investigating the difference between the products of the numbers in the opposite corners of any rectangles that can be put on a 100 square. 2 x 3 Rectangles 2 3 1 2 3 To keep things simple I have started with rectangles with a width of 2 squares. I kept the width to two squares and increased the length by one square. (see results table above). I discovered that the width increases by 10 every time the length increases by 1. The difference can be worked out for all rectangles with a width of 2 squares by using several formulas: . (Length - 1 x 10 = Z) 3 - 1x 10 = 20 = Z Then (Width x Z ) - Z = difference of opposite corners 2 x 20 - 20 = 20 OR 2. L = Length, W = Width (L - 1) (10 (W-1)) = difference of opposite corners Example: (3 - 1) x (10 (2 - 1)) = 20 OR 3. 2 3 1 2 3 Using algebra and going on the theory that the width increases by 10 when the length is increased by 1, I have
Tbe Open Box Problem
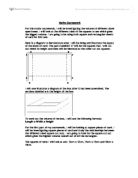
The open box problem By Luke Johnston An open box is to be made from a sheet of card with identical squares cut of the corners to make a box: y x = corner length y = box length The card is then folded along the dashed lines to make the box. The aim of this activity is to determine the size of the cut out square which makes the largest volume for a square. Firstly I will find this in a square of y = 10cm To find the volume I will use this equation-Volume= Width x length x height Cut off (cm) width (cm) length (cm) height (cm) volume (cm²) 8 8 64 2 6 6 2 72 3 4 4 3 48 4 2 2 4 6 The maximum box volume is made from the cut out square of 2cms. I will now try between 1-2 cm because the highest volume is somewhere between them. Cut off (cm) width (cm) length (cm) height (cm) volume (cm²) .1 7.8 7.8 .1 66.924 .2 7.6 7.6 .2 69.312 .3 7.4 7.4 .3 71.188 .4 7.2 7.2 .4 72.576 .5 7 7 .5 73.5 .6 6.8 6.8 .6 73.984 .7 6.6 6.6 .7 74.052 .8 6.4 6.4 .8 73.728 .9 6.2 6.2 .9 73.036 2 6 6 2 72 The highest value of x is 1.7, but once again I will find a volume even higher in the 10 by 10 box by going into two decimal places. Cut off (cm) width (cm) length (cm) height (cm) volume (cm²) .61 6.78 6.78 .61 74.0091 .62 6.76 6.76 .62 74.0301 .63 6.74 6.74 .63 74.047 .64 6.72 6.72 .64
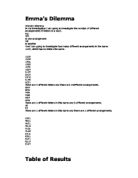
Emma's Dilemma.
Emma's Dilemma Emma's Dilemma In my investigation I am going to investigate the number of different arrangements of letters in a word. e.g. Tim Is one arrangement Mit Is another First I am going to investigate how many different arrangements in the name LUCY, which has no letters the same. LUCY LUYC LYCU LYUC LCYU LCUY ULCY UCLY UYLC ULYC UCYL There are 4 different letters and there are 24different arrangements. SAM SMA MSA MAS ASM AMS There are 3 different letters in this name and 6 different arrangements. JO OJ There are 2 different letters in this name and there are 2 different arrangements. UYCL YCUL YUCL YULC YLCU YLUC CYLU CYUL CUYL CULY CLUY Table of Results Number of Letters Number of Different Arrangements 2 2 3 6 4 24 5 20 6 720 7 5040 From the table of results I have found out that a 2 letter word has 2 arrangements, and a 3 letter word has 6. Taking for example a 3 letter word, I have worked out that if we do 3 (the length of the word) x 2 = 6, the number of different arrangements. In a 4 letter word, to work out the amount of different arrangements you can do 4 x 3 x 2 = 24, or you can do 4!, which is called 4 factorial which is the same as 4 x 3 x 2. So, by using factorial (!) I can predict that there will be 40320 different arrangements for an 8 letter word. The formula for this is: n! = a Where n =
Newspaper Comparisons
Adam Deas Newspaper Comparisons GCSE Maths Statistics Assignment For Newspaper Comparisons Statistics Project The data I collected I found in the Times, Daily Star and the Observer. I chose these newspapers because they are all completely different types of papers, for example the article in The Times is twice as long as the article in the Daily Star. With the similar articles from the different newspapers I am going to count up how many: * Paragraphs * Lines * Words * Characters * Characters (with spaces) Once I have established all of my data I will start to compare and contrast my results. I will construct these results in a series of pie charts, graphs and tables. The Category I have chosen to target is about Terrorism. I have decided to refine my category to the, Charging Over Tube Terror Plot. The three papers I have chosen have the same title within a couple of words of each other. I have chosen three papers so that I can produce a wider range of results in my assignment; I also create a better average in my statistics. The categories I have chosen are in all three of my papers with the same articles, this is why I chose these papers plus the articles are an adequate size for what I need. The articles are of a size to gain all of my information needed to carry out my assignment to its full potential. Measurement of space was not helpful as some

The Relationship between the T-Number and the T-Total
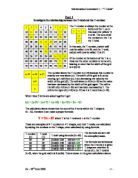
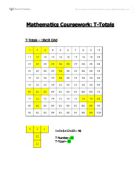
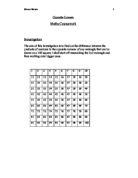
The Relationship between the T-Number and the T-Total The T-Total is the number that is derived from the sum of all numbers within a 'T' shape placed on a numbered grid. The T-Number is the number at the bottom of the 'T' : I have been asked to find the relationship between the T-number and The T-Total and devise a formula to derive the T-Total from any given T-Number of any translation of the 'T' shape. The grid below is 9*9 meaning that any number on the grid is nine less than the one below. This means that the number above the T-Number will always be 9 less than it, it also means that the number two squares above the T-Number is 18 less and the two either side are 17 less and 19 less than the T-Number. This means that: T-Number = TN T-Total = TN + TN - 9 + TN -18 + TN - 17 + TN -19 So T-Total = 5TN - 63 So to test the formula: Eg. 1 2 3 4 5 6 7 8 9 0 1 2 3 4 5 6 7 8 9 20 21 22 23 24 25 26 27 28 29 30 31 32 33 34 35 36 37 38 39 40 41 42 43 44 45 46 47 48 49 50 51 52 53 54 55 56 57 58 59 60 61 62 63 64 65 66 67 68 69 70 71 72 73 74 75 76 77 78 79 80 81 + 2 + 3 + 11 + 20 = 37 And: 5*20 = 100 - 63 = 37 Eg. 2 2 3 4 5 6 7 8 9 0 1 2 3 4 5 6 7 8 9 20 21 22 23 24 25 26 27 28 29 30 31 32 33 34 35 36 37 38 39 40 41 42 43 44 45 46 47 48 49
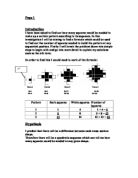
have been asked to find out how many squares would be needed to make up a certain pattern according to its sequence
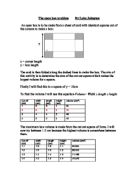
Page 1 Introduction I have been asked to find out how many squares would be needed to make up a certain pattern according to its sequence. In this investigation I will be aiming to find a formula which could be used to find out the number of squares needed to build the pattern at any sequential position. Firstly I will break the problem down into simple steps to begin with and go into more detail to explain my solutions such as the nth term. In order to find this I would need to work of the formula: Term 1 Term 2 Term 3 Term 4 B=1 B=5 B=13 B=25 W=4 W=8 W=12 W=16 Pattern Dark squares White squares Number of squares 4 + 4 = 5 2 5 8 5 + 8 = 13 3 3 2 3 + 12 = 25 Hypothesis I predict that there will be a difference between each cross-section shape. Therefore there will be a quadratic sequence which can tell me how many squares would be needed in any given shape. Page2 Prediction + 3 + 1 = 5 + 3 + 5 +3 + 1 = 13 + 3 + 5 + 7 + 5 + 3 + 1 = 25 + 3 + 5 + 7 + 9 + 7 + 5 + 3 + 1 = 41 If you notice in my prediction there is a pattern of
In this investigation I will be looking at the relationship between the T-total and the T-number with simple drawings and try to identify a general rule.
Maths Coursework Introduction This piece of coursework is about T- totals. I will be looking a T- Shape (see below) drawn on a 9x9 number grid. The number at the bottom of the shape is called the T- number. In this investigation I will be looking at the relationship between the T-total and the T-number with simple drawings and try to identify a general rule. Drawings To help me in my investigation I have produced 3 drawings, the 4th being my prediction in a grid which is 9x9. (T-n = T- Number T-t = T-Total) T-n= 21 + 12 + 1 + 2 +3 = 39 (T-t) T-n= 41 + 32 + 22 + 23 + 24 =142 (T-t) T-n= 61 + 52 + 42 + 43 + 44 =242 (T-t) (Prediction) T-n= 81 + 72 + 62 + 63 + 64 = 337 (T-t) Table of Results With the T-shapes drawn in the grid above I can now put my results in a table to see if there are any patterns occurring. Identifying the pattern As you can see from my table of results that the T-total is increasing by 100 every time you add 20 to the T-number. Prediction I predict that the next T-total will be 337 and the T-number will =80. My prediction is already included on the 9x9 grid it is the Green T-shape. Testing my prediction My prediction was correct as you can see on the grid the green T-shape =337. T-n= 81 + 72 + 62 + 63 + 64 = 337 (T-t) General Rule The general