:
After examining all of this information, an expression can be used to describe it:
2L-2 = T This means that twice the length of side - L minus 2) will equal the time for the whole tray to go bad. The reason for this expression working is using the XY rule, when a tomato in the corner goes bad, the one in the opposite corner will be the furthest one away. In this expression the two sides on route from corner to corner are represented by 2L but there is 2 taken away from this to account for the original bad tomato and the corner tomato which the two sides share.
If the original bad tomato’s postion is changed, the above expression will not apply anymore. Now I’ll change the bad tomato to being in the middle of a tray. There are now two possibilities as to where the bad tomato will be. If an even numbered L x L grid is used there are 4 different middle positions:
But if an odd L x L grid is used, there is only one middle position for the bad tomato:
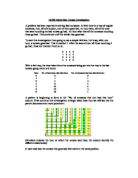
Let’s start by looking at the even numbered L tray. If we start in the middle of the tray with tomato 6 going bad:
The furthest tomato away from the tomato 6 is tomato 16. Using the XY rule, it should take four hours for the whole tray to go bad. Here is a table showing the order of tomatoes going bad for that tray:
Hour (H) No. of bad toms after that hour (N) Tomatoes which are bad
0 1 6
1 5 6, 2, 5, 7, 10.
2 11 6, 2, 5, 7, 10, 1, 3, 9, 11, 8, 14.
3 15 6, 2, 5, 7, 10, 1, 3, 9, 11, 8, 14, 13, 15, 4, 12.
4 16 6, 2, 5, 7, 10, 1, 3, 9, 11, 8, 14, 13, 15, 4, 12, 16.
Having established that the XY rule works, which it should, let’s have a look at some other sized even squares with bad toms in the middle:
Size (LxL) Amount of time for whole tray to go bad [T(in hours)]
2x2 2
3x3 3
4x4 4
5x5 5
6x6 6
7x7 7
The pattern here is obviously the size L is equal to T. This is because the distance from the bad tom to the furthest edge from it is always half of L and from that point to the furthest tom is always half L again:
This proves that the expression for working out how long it takes for a square tray to go bad is L = T .
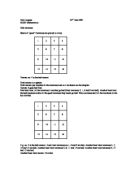
Now, if we put the bad tomato in the middle of an odd numbered L x L tray like this:
The whole tray goes bad very quickly for a one of this size. It only takes 4 hours for the whole tray to go bad. Here is a table showing how long it takes for some other odd numbered L trays go bad with bad toms in the middle:
Size (L x L) Amount of time for whole tray to go bad [T(in hours)]
3x3 2
5x5 4
7x7 6
9x9 8
11x11 10
There is another obvious pattern in this table, it’s that the time taken for the whole tray to go bad is always size L minus 1. This is because going along diagonally from the bad tomato in the middle, it will always be half of (L - 1) no. of toms away:
Along with the two tomatoes on route from middle to corner, the two below them need to be taken to make a staircase type route from middle to corner. This is a quickest route from bad tom to furthest tom i.e. XY rule, which proves that it takes 4 hours for this tray to go bad with the first bad tom in middle. Therefore, an expression can be drawn to show how long it takes for trays to go bad when a bad tomato is in the middle of an odd numbered L x L tray: L - 1 = T .
Now the bad tomato will be on the edge of a square tray. This is more difficult to work out because the tomato could be in the middle of the edge, near the corner but still on the edge or not in the middle or the corner and be in no real place that can be described. So as not to complicate this problem any further I’ll look at a tomato on the edge of a 4x4 tray:
Here, if say, tomato 5 goes bad, it takes 5 hours for the tray to go bad. Having looked at some other sized grids in the table below where the first bad tomato is on the edge but next to a corner:
Size (L x L) Amount of time for whole tray to go bad [T(in hours)]
3x3 3
4x4 5
5x5 7
6x6 9
7x7 11
From this an expression can be used to descrbe how the size relates to the amount of time, it is 2L - 3 = T .
For other tomatoes on the edges and for that matter, any tomato anywhere on a square tray, an expression can be formed using two extra values. I have called these D and D2. D is the distance from the first bad tomato to the side furthest from it, and D2 is the distance from the first bad tomato to the side which is second furthest from it. The expression which shows how long it takes for a square to go bad no matter where the bad tomato is is: D + D2 = T . This works due to the XY rule because the distance A, which is from tomato X to the furthest side from it is the normal route to the furthest tomato from it(going according to the XY rule). And distance B finishes off the route to tomato Y but on the opposite side of the square.
The best thing about the above expression is that it works for any tomato going bad first in any sized square.
Now, let’s have a look at something slightly more complex, an infinitely big tray of tomatoes. If a tomato goes bad in the corner of an infinitely big tray of tomatoes, a triangular number type pattern will happen. I will illustrate it in the table on the next page:
:
Hour (H) No. bad toms bad afterhour H (N) No. toms going bad at
hour H (B)
0 1 1
1 1+2 2
2 1+2+3 3
3 1+2+3+4 4
4 1+2+3+4+5 5
5 etc.
These are called triangular numbers because as you write them down they form a triangle type shape. For any infinitely big square, an expression can be formed to show the growth rate of the amount of tomatoes going bad each hour. In this case it’s H + 1 = B . This is because at hour 0 the first tomato went bad, therefore immediately the expression works. Next, because it’s a triangular number pattern, the amount going bad each hour will increase by one each time:
A table can also be drawn which relates the hour at which the tomatoes go bad with the total number of bad tomatoes:
Hour (H) Total number of bad tomatoes (N)
0 1
1 3
2 6
3 10
4 15
5 21
From this table an expression can be used to relate H to N. It contains a new variable which I’ll call P. P = H+1. Therefore the expression is P2 + P = N .
This means that if we take three as an example, 2
3+1 = 4, squared, plus 4 equals 20, divided by two equals 10. This works because the second difference between the number of bad tomatoes is constant(as illustrated in the table on the next page):
N difference 1 difference 2
1
3 +2
6 +3 +1
10 +4 +1
15 +5 +1
21 +6 +1
It is always +1, this means that an expression to describe it will envolve H2, or in this case P2. Clearly though P2 is not enough as 1, 4, 9, 16 etc. doesn’t equal 1, 3, 6, 10 etc. Therefore an extra part needs to be added. When I was working this out, I took a few steps to make sure it was right. Here they are:
P2+ P = N
2
(x2)= P2+P =2N
(/N)= P+1=2N
P
(/2)= P+1 = N
2 P
Now, if we substitute any number with its prospective answer, say use H as 4, then +1 to make P(as N is 15 when P is 5):
5+1 = 15
2 5
6 = 3
2 1
These are obviously equal, thereby proving that the expression works.
Next I’ll change the first bad tomato to being in the middle of an infinitely big tray. This is what it looks like after the first couple of hours:
After looking at the diagram at the bottom of the previous page, a simple growth rate formula can be constructed to show how many tomatoes go bad at each hour, it is
4H = B . To check if this works, I’ll input the data of growth into a table for the first few hours:
Hour (H) No. of tomatoes going bad at hour H (B)
1 4
2 8
3 12
4 16
5 20
This proves that the growth rate formula is right. Now a more difficult formula will need to be constructed to show the amount of bad tomatoes altogether after H hours have elapsed. This is 2H2+2H+1 = N . This, when factorised can also be written
2H(H+1)+1 = N . This was formula was drawn from the table below:
Hour (H) Total number of bad tomatoes(N)
0 1
1 5
2 13
3 25
4 41
5 61
This can be proved to work because if you take the growth rate of 4H, and add it on to the figure diagonally across from it in the table, in this case 4H or 4x1+1 = 5. This means that if a proven formula works with the figures, then another formula which gives exactly the same answers must work.
To finish off dealing with infinitely big squares, I’ll have a look at what happens when a tomato goes bad on the edge of it. Here are the values for the amount of tomatoes going bad each hour, they are presented in a table on the next page:
:
Hour (H) No. of tomatoes going bad at hour H (B)
0 1
1 3
2 5
3 7
4 9
5 11
A simple growth rate formula can be drawn from this information, it is 2H+1 = B . This can be illustratively proved in the diagram below:
This diagram means that the adding one extra part of the formula is representing the middle row of the diagram which always adds one onto the total number of tomatoes going bad that hour. The 2N part is representing the fact that if the middle row is labelled with the hour at which they go bad, the tomatoes in diagonal lines going back from them will always be twice the label on that middle tomato. A similar expression can be made to describe the total number of bad tomatoes after H hours, it can be drawn from the table below:
Hour (H) Total number of bad tomatoes (N)
0 1
1 4
2 9
3 16
4 25
5 36
The expression is obviously (H+1)2 . This works because after say 2 hours, there have been three times at which tomatoes have gone bad - hr0, hr1 + hr2. At hour 2 there are 3 columns from the edge and there are 3 tomatoes in the middle row. There are also two rows of two tomatoes and two rows of one tomato. This means 3+2+2+1+1, which = 9. This proves that there are 9 bad toms after 2 hrs. This pattern conitinues to the next hour where we have 4+3+3+2+2+1+1 which = 16, and so on.
Having looked at how the trays go bad, I’m now going to look at how much it costs for the trays to go bad when they are stacked with other trays. If a tomato goes bad in the normal packing method of an HxH box, if one goes bad, they’re all bad after a short amount of time. But if they were packed in a chessboard-type formation with all tomatoes on either the black squares or the white squares, it wouldn’t affect any of the other tomatoes if one went bad, as none of the tomatoes would share an edge with any other. And if a few trays of tomatoes were stacked on top of each other with alternating trays being on the black squares and the white squares, no tomatoes in any other trays would be affected with one going bad either.
Now if the tomatoes were in a box, stacked in a 3-D form, they would effectively have a Z-axis, aswell as an X and Y to contend with, and infect. If a tomato went bad in the corner of a set of 3 3x3 trays stacked on top of each other, it would take 6 hours for the set to go bad:
Hour (H) No. of tomatoes going bad at hour H (B) Total No. of bad toms (N)
0 1 1
1 3 4
2 6 10
3 7 17
4 6 23
5 3 26
6 1 1
Now I’ll make a table showing how long it takes other cubed sets of trays to go bad:
Size (LxLxL) Time taken for all toms to go bad in hours (T)
2 3
3 6
4 9
5 12
6 15
From this the obvious formula for the amount of time for a cube of tomatoes, or stacked set of trays to go bad is 3L-3 = T . It would be very difficult to try to find any other formulas for cubes of fixed size as specificity of the tomato going bad becomes very complex in 3-D.
The last thing which I will look at is an infinitely big 3 dimensional cubed tray with a the first tomato going bad in the middle. It’s growth rate pattern will probably be very similar to a 2-D tray, the 2-D pattern was 4H. Here is a table showing howmany tomatoes were going bad each hour, it’s on the next page:
:
Hour (H) No. of toms going bad at hour H (B)
1 6
2 18
3 38
4 66
5 102
The pattern here is in fact very similar to the 2-D infinite square starting at middle one, it’s 4N2+2 = B . The squared part of the formula is to add an extra dimension to it. Here Concludeth my Investigation.
David Langer 10SM