C/W Max Box Coursework John Tovey 11M 31/10/05
Introduction
I am doing an investigation into how get the maximum volume from a cuboid using a square with smaller squares cut out from each corner to then fold it up into a cuboid.
Cut out the red squares and fold inwards on the blue lines to get a cuboid.
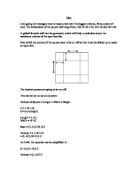
To get the maximum volume from the cuboid you need to work out the sizes of the squares you want to cut out from each corner. The formula I used to work out the volume for each cuboid was height x width x length. Height is the width or length of the cut out square. Width is the length of the square minus 2H, (2H is the width of the cut out square times two). Width and length are the same.
How I got started
Firstly I chose a size of square to use, I chose 20cm. After this I went through all of the possible lengths for the cut out squares to be. I started by going through centimetres, 1cm to 4cm. I found the turning point between 3cm and 4cm, it was 588cm^3. This now gave me a wider range of numbers to work with. I now went through the numbers 3.1cm to 3.9cm. I found the turning point at 3.3cm, it was 592.54cm^3 I didn't bother going further than 3.6cm because there was no point because I had found the turning point. Now I had a more specific area of numbers to go through. I now went through the numbers 3.31cm to 3.36cm. I found the turning point at 3.33cm, it was 592.592cm^3.
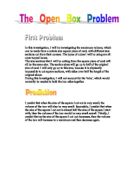
Introduction
I am doing an investigation into how get the maximum volume from a cuboid using a square with smaller squares cut out from each corner to then fold it up into a cuboid.
Cut out the red squares and fold inwards on the blue lines to get a cuboid.
To get the maximum volume from the cuboid you need to work out the sizes of the squares you want to cut out from each corner. The formula I used to work out the volume for each cuboid was height x width x length. Height is the width or length of the cut out square. Width is the length of the square minus 2H, (2H is the width of the cut out square times two). Width and length are the same.
How I got started
Firstly I chose a size of square to use, I chose 20cm. After this I went through all of the possible lengths for the cut out squares to be. I started by going through centimetres, 1cm to 4cm. I found the turning point between 3cm and 4cm, it was 588cm^3. This now gave me a wider range of numbers to work with. I now went through the numbers 3.1cm to 3.9cm. I found the turning point at 3.3cm, it was 592.54cm^3 I didn't bother going further than 3.6cm because there was no point because I had found the turning point. Now I had a more specific area of numbers to go through. I now went through the numbers 3.31cm to 3.36cm. I found the turning point at 3.33cm, it was 592.592cm^3.