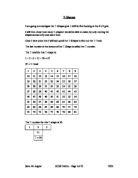
To help me with this I used counters in place of the frogs and drew a grid.
I had to get the three black counters into the position the white counters are currently in on the diagram and vice versa for the white counters.
Here are the moves I used in which to achieve this:
-
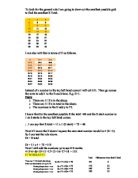
Slide Black 6. Slide Black 11. Jump Black
-
Jump white 7. Jump white 12. Jump Black
-
Slide white 8. Jump white 13. Slide white
-
Jump Black 9. Jump white 14. Jump white
-
Jump Black 10. Slide Black 15. Slide Black
This was for three black frogs and three white frogs.
Then I carried on doing this for
4 black and 4 white
5 black and 5 white
6 black and 6 white
etc…
I looked at the relationship between the black and white moves and found a formula from that which would have been adequate for use.
This was the formula:
(n/2)²+n
I then looked over the results I had and saw that there was symmetry between the jumps and slides so I found a new formula which I found easier to use and I could prove that it worked using a graph too.
So, whilst I did this I noticed that the patterns of slides and jumps were symmetrical for example:
S J S J J S J J J S J J S J S
This will now help me to predict the other results accurately.
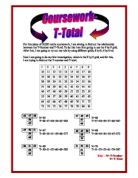
- Next I will draw a table to present my results.
From this table of results you can see that the number of jumps goes up in squared numbers. The number of slides goes up in 2’s.
-
From the results in my table I will try to find a formula that will enable me to find the total number of moves for any number of frogs on a side.
I looked through my results and saw that there could be a relationship between the jumps and slides for each one. I saw that the jumps went up in squared numbers so I used n² for the first part of my formula. In the slide column I saw that the data went up in 2’s so I made this 2n and used this for the second part of my formula by adding them together
So my formulae is: n²+2n
- Now I have to prove that this formula works.
For 1 frog on each side
S J S
1²+(2x1) = 3
As you can see referring back to the table of results that the answer is correct and the sequence is symmetrical.
I will do this again for another number of frogs
For 4 frogs on each side:
S J S J J S J J J S J J J J S J J J S J J S J S
4²+(2X4) = 24
As you can see again referring back to the table of results that the answer is correct and the sequence is also symmetrical.
- Now that I have proven the formulae works I will use it in a graph
To do this to find the points I have rearranged the formula.
So:
C=n²+2n
-c)
0=n²+2n-c
Now I will substitute the required values into it to create co-ordinates to plot onto my graph.
E.g. using the total moves for 4 frogs.
0=n²+2n-24
This factorizes to:
0=(n – 4)(n + 6)
Therefore:- n= 4 or -6
-6 is impossible in this situation
I will try this now with the total moves for 5 frogs
0=n²+2n-35
This factorizes to: 0= (n – 5)(n + 7)
Therefore:- n= 5 or -7
-7 is again impossible in this situation as you can’t have a minus number of frogs
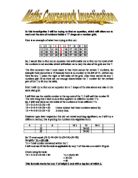
- Now I will draw up my graph.
The graph also helps with proving that my formulae works as the line passes through the x axis at 4 so this works.
My graph will start to go into negative figures but this is not important as you can’t have a negative number of frogs so this is irrelevant to the investigation.
- Now I will try to further my investigation by trying to find a relationship between the numbers of frogs on each side. For example having 2 white frogs on one side and 3 black frogs on the other side.
I repeated the process using the counters doing it in this way.
I will then repeat the process for different numbers of frogs as I did in the beginning.
This is the table of results I came up with.
I now wanted to find a rule which would enable me to find the total number of moves when only knowing the number of frogs on each side.
I tried lots of different rules but I found it very difficult to find a relationship between them.
The best I came up with was 2n+2 which would find you the number of slides when you know the number of white frogs on a side.
To try and find another way to do this I added in to the table the number of black moves and the number of white moves.
The two new columns are in red.
I noticed straight away that there was always one more black move than the white, the difference between both is 3 then 4 then 5, etc.
Evaluation
In this investigation I think that I did reasonable well with what I had managed to find. I saw the connection between the Black moves and white moves first and came up with a different formula, but then I re-looked over the results and saw that there was symmetry between the jumps and slides. I thought from this I could find an easier way to prove that the formula did actually work. I was then able to show on a graph that formula worked as the line crossed the x axis at exactly the right point. After this I tried to find the formulas for different numbers of frogs on each side (2 white, 3 black, etc…).