Investigation into some of the statistical differences between The Sun, The Daily Mail and The Daily Telegraph
Introduction:
The aim of this project is to compare the three daily-published papers. The three papers that will be used are THE SUN, THE DAILY MAIL and THE DAILY TELEGRAPH, all purchased on the same day. A lot of data can be easily collected from these newspapers, ranging from average word length to area devoted to adverts per page.
The project will attempt to reach conclusions regarding three specific hypotheses. In answering these questions a range of sampling methods, presentation of data, and statistical calculations will be used in order to interpret and evaluate the data and come to a valid conclusion, drawing together all the data.
Each question will be presented and it will be explained what statistical methods will be involved in drawing conclusions for these questions.
Question 1:
What is the average amount of words per sentence?
This involves collecting specific data:
* Take random samples in different articles. By doing every page of the newspaper would take too long, so by splitting up the newspaper in to equal amounts would be a fairer way. I would do this by counting all the pages in all three papers, which is 196, and calculate the ratio for all three papers (See later on for calculations.)
* From doing this I will be able to calculate the mean amount of words per sentence for all three papers.
* I predict that The Daily Telegraph will have more words per sentence because that particular paper uses more intellectual text so they would use longer words, which in turn make the sentence longer.
Question 2:
* What is the most common type of advertisement and how much space is given to each?
This involves collecting particular sets of data:
* Number of times a specific type of advert occurs: This will be done simply by looking through the paper and making a tally chart of all the different adverts
Whilst making the tally chart of the different adverts I will also be recording the area of each advert which will be recorded in centimeters squared. All these results can then be added up to give the total area devoted to each advert type.
To make any calculations accurate enough to draw a valid conclusion I will need to collect at least twenty sets of data from each paper. The only fair way to do this is to collect data from the whole of the three papers, as this gives a much better picture and proves one hundred percent that my results are correct of how much advert space there is in each paper.
There are a few way to show this data but, I have chosen one way of showing it. The first way you could use is to draw a line graph of the amount of each advert used in the papers and the Second way (I am going to use) is to use corresponding pie charts. One showing the type of advert used and the other displaying the area devoted to each type
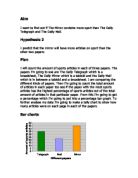
* For the question I predict that The Daily Telegraph would again have the most amount of adverts in the paper because it have a larger sheet to fill so instead of making the articles longer they would put in more adverts
Question 3:
* To investigate the area of the front page and the sport page and how great a percentage is taken up by the following subjects:
Introduction:
The aim of this project is to compare the three daily-published papers. The three papers that will be used are THE SUN, THE DAILY MAIL and THE DAILY TELEGRAPH, all purchased on the same day. A lot of data can be easily collected from these newspapers, ranging from average word length to area devoted to adverts per page.
The project will attempt to reach conclusions regarding three specific hypotheses. In answering these questions a range of sampling methods, presentation of data, and statistical calculations will be used in order to interpret and evaluate the data and come to a valid conclusion, drawing together all the data.
Each question will be presented and it will be explained what statistical methods will be involved in drawing conclusions for these questions.
Question 1:
What is the average amount of words per sentence?
This involves collecting specific data:
* Take random samples in different articles. By doing every page of the newspaper would take too long, so by splitting up the newspaper in to equal amounts would be a fairer way. I would do this by counting all the pages in all three papers, which is 196, and calculate the ratio for all three papers (See later on for calculations.)
* From doing this I will be able to calculate the mean amount of words per sentence for all three papers.
* I predict that The Daily Telegraph will have more words per sentence because that particular paper uses more intellectual text so they would use longer words, which in turn make the sentence longer.
Question 2:
* What is the most common type of advertisement and how much space is given to each?
This involves collecting particular sets of data:
* Number of times a specific type of advert occurs: This will be done simply by looking through the paper and making a tally chart of all the different adverts
Whilst making the tally chart of the different adverts I will also be recording the area of each advert which will be recorded in centimeters squared. All these results can then be added up to give the total area devoted to each advert type.
To make any calculations accurate enough to draw a valid conclusion I will need to collect at least twenty sets of data from each paper. The only fair way to do this is to collect data from the whole of the three papers, as this gives a much better picture and proves one hundred percent that my results are correct of how much advert space there is in each paper.
There are a few way to show this data but, I have chosen one way of showing it. The first way you could use is to draw a line graph of the amount of each advert used in the papers and the Second way (I am going to use) is to use corresponding pie charts. One showing the type of advert used and the other displaying the area devoted to each type
* For the question I predict that The Daily Telegraph would again have the most amount of adverts in the paper because it have a larger sheet to fill so instead of making the articles longer they would put in more adverts
Question 3:
* To investigate the area of the front page and the sport page and how great a percentage is taken up by the following subjects: