Mathematics (Statistics) Coursework: Read All About It!
Thomas Amendt 10KL 10A1
Mathematics (Statistics) Coursework: Read All About It!
Hypotheses
Tabloids have a higher percentage of space taken up by adverts than broadsheets.
Tabloids have more single adverts covering over half a page than broadsheets.
Tabloids have more pages with no adverts than broadsheets do.
Tabloids have a greater spread of advert sizes than broadsheets do.
Plan
Sampling Data
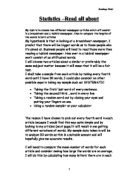
* I will use two broadsheet papers (the Times and the Telegraph) and two tabloid newspapers (the Daily Mail and the Mirror)
* I will take a stratified sample of each newspaper depending on the number of pages there are in that paper. I will be collecting data from 20% of the number of pages in each paper.
* I shall include all supplemental magazines and inserts but I will not include any leaflets found inside the paper.
* To avoid bias, I will randomly select the pages I will sample by using the ran# function on a scientific calculator. This will generate a random number.
* For the number of half- and full-sheet adverts (adverts that occupy over half the printable area of the page) and pages with now adverts, I will sample every page of every newspaper. This is to ensure that I will not miss any pages out.
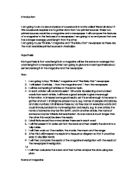
* To calculate the percentage of space an advert takes up, I will use the following formula:
where 'a' equals the total area of all adverts on the page and 'p' equals the total area of the page. For example:
Recording evidence
* I will record my results in a tally chart
* I will group my data in multiples of 10% e.g. 0%<x?10%, 10%<x?20%.
* I will produce 2 cumulative frequency graphs based on the percentage of adverts covering a page. There will be one c.f. graph for the tabloids and one c.f. graph for the broadsheets. They will be overlaid so comparisons can be made between the two.
* To make the 2 c.f. graphs comparable, I will convert the c.f. into a percentage
* I will also produce 2 box and whisker diagrams to see how varied the space taken up by adverts is.
* I will work out the IQR from this data as a measure of how spread out the page coverage is.
* I will also work out the mean, median and mode to see what the average page coverage is for Ts and Bs to compare in my conclusion and also the standard deviation and range to see how spread out the page coverage is for T's and B's
* I will produce a bar chart to show the percentage of the newspaper taken up by adverts over 1/2 the size of the page and the ...
This is a preview of the whole essay
* I will work out the IQR from this data as a measure of how spread out the page coverage is.
* I will also work out the mean, median and mode to see what the average page coverage is for Ts and Bs to compare in my conclusion and also the standard deviation and range to see how spread out the page coverage is for T's and B's
* I will produce a bar chart to show the percentage of the newspaper taken up by adverts over 1/2 the size of the page and the percentage of the pages in the newspaper that have no adverts on them at all.
Avoiding Bias
To avoid bias I must do the following:
* Use stratified sampling as some papers have more pages than others. Taking a stratified sample ensures that I am taking into account the total number of pages
* Use random sampling within the strata. This ensures that a random selection of sport, news, media, finance and advertising pages are sampled
* Make sure that all 4 papers are purchased on the same day. This ensures that the numbers of articles are the same so the size and amount of adverts are controlled by the editors of the paper only. Also, this ensures that no advertising deals will take place in between the printing of all 4 papers
Strata
Newspaper
Total pages
Total Pages to be sampled (20%)
Pages to be sampled
Telegraph
44
8
2,14,16,19,23,33,35,42
Times
68
4
4,18,21,25,31,39,42,45,54,57,61,68
Mail
80
6
5,6,11,13,16,18,23,27,32,58,65,68,72,73,78,80
Mirror
48
0
5,11,12,14,16,23,30,37,39,48
Tally Chart
Newspaper -->
Broadsheets
Tabloids
Advert Coverage ?
Telegraph
Times
Mail
Mirror
0%
0%<x?10%
0%<x?20%
20%<x?30%
30%<x?40%
40%<x?50%
50%<x?60%
60%<x?70%
70%<x?80%
80%<x?90%
90%<x?100%
No. Of Pages
44
68
80
48
Pages to be sampled
8
4
6
0
50%>x?100%
(single advert)
Pages with no adverts
Pages to be sampled
44
68
80
48
Results
Newspaper -->
Broadsheets
Tabloids
Advert Coverage ?
Telegraph
Times
Sum
Mail
Mirror
Sum
0%
7
8
5
2
7
0%<x?10%
0
0
0
3
4
0%<x?20%
2
3
2
3
20%<x?30%
0
2
2
2
3
30%<x?40%
2
0
2
2
0
2
40%<x?50%
3
0
3
0
2
2
50%<x?60%
0
2
2
0
60%<x?70%
0
0
0
0
70%<x?80%
0
0
0
0
80%<x?90%
0
0
0
0
0
0
90%<x?100%
0
2
3
No. Of Pages
44
68
12
80
48
28
Pages sampled
8
4
22
6
0
26
50%>x?100%
(single advert)
0
6
6
2
2
24
Pages with no adverts
9
3
22
37
5
52
Pages sampled
44
68
12
80
48
28
Cumulative Frequency
Advert Coverage ?
Bshts
%
Tblds
%
0%
8
36
7
27
0%<x?10%
8
36
1
42
0%<x?20%
1
50
4
54
20%<x?30%
3
59
7
65
30%<x?40%
5
68
9
73
40%<x?50%
8
82
21
81
50%<x?60%
20
91
22
84
60%<x?70%
21
95
22
84
70%<x?80%
21
95
23
88
80%<x?90%
21
95
23
88
90%<x?100%
22
00
26
00
Percentages of other data:
Advert Coverage ?
Bshts (%)
Tblds (%)
50%>x?100%
(single advert)
4%
9%
Pages with no adverts
9.5%
38.5%
Pages sampled
12
28
C.F. Graph
Box and Whisker diagrams
Bar chart
Statistics Formulae
Mean: Broadsheet calculations: Tabloid Calculations:
Standard Deviation: Broadsheet Calculations:
-26
676
5408
-21
441
0
-11
21
363
-1
2
9
81
62
9
361
083
29
841
682
39
521
521
49
2401
0
59
3481
0
69
4761
4761
4982
Tabloid Calculations:
-27.5
756.25
5293.75
-22.5
506.25
2025
-12.5
56.25
458.75
-2.5
6.25
8.75
7.5
56.25
12.5
7.5
306.25
612.5
27.5
756.25
756.25
37.5
406.25
0
47.5
2256.25
2256.25
57.5
3366.25
0
67.5
4556.25
3668.75
25202.5
Statistics
Statistic
Broadsheets
Tabloids
Mean
26%
271/2%
Median
20%
5%
Mode
0%
0%
Standard Deviation
26.71
31.76
Range
00%
00%
Interquartile Range
45%
411/4%
Lower Quartile
0%
1/4%
Upper Quartile
45%
421/2%
Conclusion
Cumulative Frequency Graph
Both sets of data on the cumulative frequency graph are close together. We can see from the first point that broadsheets have more pages with no adverts than tabloids do. However, the tabloid's cumulative frequency increases and raises above the broadsheet cumulative frequency for 10%, 20%, 30% and 40%. The two sets cross over at around 50%, where the tabloids drop behind the broadsheets. There is a greater difference between the two points now than at any other point. The broadsheets rise up even higher for 60%, 70%, 80% and 90% and finally meet up with the tabloids at 100%.
We can see from this data that in tabloids there are a greater amount of adverts covering fewer than 50% of the total area of the page than broadsheets. In broadsheets, however, there are a greater amount of adverts covering over 50% of the page than tabloids. So far, we can see that my first hypothesis has been proved wrong because we can see that broadsheets have a higher percentage of space taken up by adverts rather than tabloids - but not by much.
Box and whisker diagram, upper and lower quartile, range, Interquartile range and median
We can see from the box and whisker diagram that the minimum and maximum values are both the same and cover the full possible range (0% --> 100%). This is what I expected as both broadsheets and tabloids have full page adverts and pages with no adverts. The lower quartiles are very low. This is because the most frequent and the second most frequent results were 0% and 10% which fall into the first 25% for both tabloids and broadsheets. The upper quartiles were also low but that is due to the lower quartile. The medians are also quite low - 15% for tabloids and 20% for broadsheets. The difference between them is quite low but still shows that the advert coverage is slightly higher in broadsheets, proving my hypothesis wrong. The Interquartile range is high for both newspapers. The IQR is slightly lower for tabloids, suggesting that the spread of page coverage for adverts in tabloid newspapers is higher and proving that my fourth hypothesis is right but the difference is not significant enough to prove it.
Bar chart - single advert > 50% of the page area
Looking at the bar chart we can see that the tabloids have a higher amount of adverts covering over half the page but not by a significant amount. This states that my second hypothesis is correct but I believe that a second test is necessary to confirm it.
Bar Chart - Pages with no adverts
Looking at the bar chart we can see that the tabloids have a higher amount of pages with no adverts by a significant amount. This proves that my third hypothesis is accurate.
Mean and Mode
The mean for both types of paper are very similar so they cannot be used to prove anything. They are in the 25% area which makes it quite small. The mode is the same for tabloids and broadsheets. It is the most frequent piece of data which is 0%. This accounts for some of the low results.
Standard Deviation
The S.D.s for broadsheets and tabloids are similar but they are different enough to prove that my fourth hypothesis - Tabloids have a greater spread of advert sizes than broadsheets do - is accurate as the tabloid standard deviation is higher than broadsheet standard deviation. The standard deviation shows us how spread out the data is around the mean.
Hypotheses
* Tabloids have a higher percentage of space taken up by adverts than broadsheets.
INCORRECT - according to my results they are around the same but the broadsheet average percentage is slightly higher. We can see this in the median.
* Tabloids have more single adverts covering over half a page than broadsheets.
INSUFFICENT EVIDENCE - the two totals for broadsheets and tabloids are close together as we can see from the bar chart. The tabloid total is higher than the broadsheet total but not by much. I think that a second test will clarify the result.
* Tabloids have more pages with no adverts than broadsheets do.
CORRECT - according to my results the bar for tabloids on my bar chart is significantly higher than my broadsheet result.
* Tabloids have a greater spread of advert sizes than broadsheets do.
CORRECT - according to my results the standard deviation and interquartile range are higher for tabloids than broadsheets.