Newspaper Comparisons
For my maths coursework we have been asked to compare three different types of newspapers. They are:
Tabloid- Examples include The Sun or The Mirror, these papers cover world news but like to focus on entertainment and gossip.
Quality- Examples include The Daily Mail or The Express, these papers contain world news and comment on a variety of current events with a focus on features and leisure. It is considered a popular paper for a thinking person.
Broadsheet- Examples include The Times or The Telegraph; these papers tend to cover news from all over the world. They are renowned for their well-written articles and opinions and their readership tends to be members of the professional and business classes.
I have chosen The Sun, The Daily Mail and The Times mainly because these are the most popular and the best selling in all three categories.
We can compare the newspapers in many different ways such as picture to text ratio compared to the other papers or the average word count in an article compared to the other two newspapers. But for my investigation I will be comparing the word length in the article compared to the other newspapers, this could also be turned into the readability in terms of language levels evidenced in different newspapers, because I believe that the longer the words and more words in a particular article the more you need to know about the subject/article.
My hypothesis for this investigation is that:
* The Daily Mail will have more words in an article than The Sun including higher word length i.e. more words with more letters mainly because The Daily Mail goes into more detail than The Sun.
* The Times will have even more words in an article than The Daily Mail including higher word length.
* The Sun will have the lowest language level evidenced in the newspaper, and will have the smallest measure of spread in word length.
* The Daily Mail will have a language level set between the Observer and the Times.
* The Times will have the highest language level in terms of word length.
To carry out my hypothesis I will collect in an article all the words and how many letters make up the words. I will find this information by buying the papers and collecting the information manually. But for The Times I will visit their Website www.thetimes.co.uk and look at their archive of newspapers and collect the information from there.
I have chosen these sources of information because it is the simplest form of collecting this data. I know this data is reliable because it is primary data; I am collecting it so it will be reliable.
I will use a sample size of about 5 articles per paper so 15 articles altogether. This is a good size because then you can have a fairly accurate average.
This will be a fair sample because I will randomly pick the articles out by using this method:
* First you number all the articles in ...
This is a preview of the whole essay
I have chosen these sources of information because it is the simplest form of collecting this data. I know this data is reliable because it is primary data; I am collecting it so it will be reliable.
I will use a sample size of about 5 articles per paper so 15 articles altogether. This is a good size because then you can have a fairly accurate average.
This will be a fair sample because I will randomly pick the articles out by using this method:
* First you number all the articles in the Newspaper
* Then using the Random number generator on your calculator (RAN#) not forgetting to press how many articles you have
* This will give you a number
* Then find that number in your newspaper and use that article.
I will then use the data that I have collected to compare the mean of the newspapers, the Median and also the Cumulative frequency.
To do these I will perform these calculations:
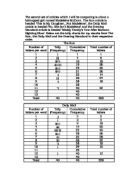
The cumulative frequency- these are a table of results of the data I have collected:
The Sun- 5 articles
Letters Per Word
Frequency
Cumulative Frequency
70
70
2
285
355
3
425
780
4
285
065
5
200
265
6
62
427
7
15
542
8
10
652
9
65
717
0
70
787
1
0
797
2
5
802
Total
802
The Daily Mail- 5 articles
Letters Per Word
Frequency
Cumulative Frequency
25
25
2
340
365
3
560
925
4
345
270
5
305
575
6
220
795
7
80
975
8
24
2099
9
96
2195
0
88
2283
1
24
2307
2
1
2318
Total
2318
The Times- 5 articles
Letters Per Word
Frequency
Cumulative Frequency
76
76
2
594
670
3
723
393
4
488
881
5
491
2372
6
307
2679
7
252
2931
8
90
3121
9
24
3245
0
56
3401
1
33
3434
2
5
3449
Total
3449
These calculations will be useful because it already shows us that The Times has more words in 5 articles than both The Daily Mail and The Sun. I can know with this information plot Cumulative frequency graphs for each of the Newspapers. I am going to use Cumulative frequency curves and box plots to display this data, as they show you clearly the median, lower quartile, upper quartile and interquartile range of the data.
See page 4 for graphs
As a result of these calculations and the graphs I will be able to compare the median, lower quartile, upper quartile and interquartile range of the data. These show how spread out the data is.
For this set of data I will also be calculating the mean deviation i.e. the mean distance of the values from their mean. These calculations will be useful because it compares all 3 newspapers by their mean deviation.
Mean Deviation: The Sun-
X
Deviation
70
50-70
80
285
285-150
35
425
425-150
275
285
285-150
35
200
200-150
50
62
65-150
5
15
50-115
35
10
50-110
40
65
50-65
85
70
50-70
75
0
50-10
40
5
50-5
45
Total= 1802/12 = 150
210
Mean Deviation = 1210/12
Mean Deviation = 100.8
The Daily Mail-
X
Deviation
25
93- 25
68
340
340-193
47
560
560-193
367
345
345-193
52
305
305-193
12
220
220-193
27
80
93-180
3
24
93-124
69
96
93-96
97
88
93-88
05
24
93-24
69
1
93-11
82
Total= 2318/12 = 193
608
Mean Deviation = 1608/12 Mean Deviation = 134
The Times-
X
Deviation
76
287-76
211
594
594-287
307
723
723-287
436
488
488-287
201
491
491-287
204
307
307-287
20
252
287-252
35
90
287-190
97
24
287-124
63
56
287-156
31
33
287-33
254
5
287-15
272
Total= 3449/12 = 287
2331
Mean Deviation = 2331/12
Mean Deviation = 194.3
I am also going to work out the standard deviation of the data I have collected, as it is a good way of measuring the spread, as it takes into consideration all of the data.
A large measure of spread will show a higher language level, because every sentence needs small words such as "a", "it", "and", "the" and "I" to make sense, and a large measure of spread would show that there are words with a lot of letters as well. A small measure of spread would show that the word length is not varied that much, but it may mean that either the words were all mostly short, mostly long, or somewhere in-between. So I will have to look at the frequency of word length shown in the tables I did earlier to back up my conclusions.
The formula for working out standard deviation is:
But I am going to use a table to work out my answers, as it will take less time, but it is still has the same principle.
Standard Deviation: The Sun-
X
X minus the mean (X-X)
(X-X)2
70
-80.2
6432
285
34.8
8171
425
274.8
75515
285
34.8
8171
200
49.8
2480
62
1.8
39
15
-35.2
239
10
-40.2
616
65
-85.2
7259
70
-80.2
6432
0
-140.2
9656
5
-145.2
21083
Total = 1802
Total = 178193
Mean = 1802/12 Mean = 150.2
Standard Deviation =
Standard Deviation = 9.9
The Daily Mail-
X
X minus the mean (X-X)
(X-X)2
25
-168.2
28291
340
46.8
21550
560
366.8
34542
345
51.8
23043
305
11.8
2499
220
26.8
718
80
-13.2
74
24
-69.2
4788
96
-97.2
9447
88
-105.2
1067
24
-169.2
28628
1
-182.2
33196
Total = 2318
Total = 307943
Mean = 2318/12 Mean = 193.2
Standard Deviation =
Standard Deviation = 11.5
The Times-
X
X minus the mean (X-X)
(X-X)2
76
-211.4
44689
594
306.6
94003
723
435.6
89747
488
200.6
40240
491
203.6
41452
307
9.6
384
252
-35.4
253
90
-97.4
9486
24
-163.4
26699
56
-131.4
7265
33
-254.4
64719
5
-272.4
74201
Total = 3449
Total = 604138
Mean = 3449/12 Mean = 287.4
Standard Deviation =
Standard Deviation = 13.2
Now I have the standard deviation for each of the sets of data I can know put this into a normal distribution curve (see page 9). This diagram will be useful because it shows how many standard deviations away from the mean the spread is. I will be able to compare the spread of all 3 newspapers.
My calculations have helped me to state that The Times had more words in 5 articles than both The Sun or The Daily Mail. This has shown my Hypothesis to be correct. My table helped me to show this easily so I could compare all three newspapers by looking at the three tables.
The Times also has the highest word length in an article compared to both The Sun and The Daily Mail. The Daily Mail did have a larger word length than The Sun though. This has shown my hypothesis to be correct.
On the cumulative frequency curves The Sun has the smallest Inter quartile range whilst The Times and The Daily Mail has the largest inter quartile range.
The Times has the highest median for letters per word.
The Sun has the smallest measure of spread and the lowest quartile for letters per word.
The Daily Mail has the highest upper quartile.
Using standard deviation to measure the spread of the word length, I think was the best way of tackling that part of the investigation, as it took into consideration all of the data I had collected, and it made it easier for me to analyse the language levels. I had worked out that a large measure of spread would show a higher language level, and that a small measure of spread would show that the word length is not varied that much, but it may mean that either the words were all mostly short, mostly long, or somewhere in-between. By working out the standard deviation I was able to work out the following information:
The Times has the highest mean and the largest measure of spread for letters per word, showing that it has the highest language level out of all the newspapers which proves the hypothesis I made, about the Times having the highest language level in terms of word length correct.
The Daily Mail standard deviation values are in-between those of The Sun and The Times, which proves the hypothesis I made correct.
The Sun had the smallest measure of spread and the lowest mean for letters per word, which shows us that it has the lowest language level out of all of the newspapers; this corresponds with the hypothesis I made about measure of spread for The Sun.
Thus my entire hypotheses were correct.
I could have improved this investigation by using a bigger sample size and also investigating into other areas of the newspaper like the amount of space devoted to items and the sizes, number of pages and cost of the different newspapers.
rajiv aery Page 1 09/05/2007