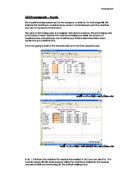
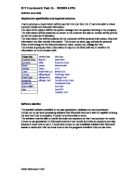
I will show what the data actually shows by going a screen dump. First I will show it with the formulas and then without.
With:
Without:
The next tasks I have to achieve are changing the values of the data and then predict the effect that will happen on the data.
I predict that for the first change the standard pay will increase dramatically because the hours worked will be multiplied by 10 and as I am increasing hourly rate to £10 not £8. So that means the total pay will increase, so then the net pay will increase.
The second change I did was changing Bryson’s total hrs from 70 to 50. So this is a decrease in the total hours Bryson works so his overall net pay will decrease
The third change is the same as before I changed the hours worked. I changed fothergill’s hours from 35 to 48 hours per week so this will increase his net pay
Then for the fourth change, things will also change because “C. Clayton’s” “Total hours” worked changed it went up from 35 to 50 so her wage slip is going to be more, so the “Total wage bill” will be more.
Now I will predict another change in the data, I will change the same data that I have already changed in the previous objectives. I predict that if I double the hours C. Clayton, works she will get 50% more salary. The total wage bill will also increase but by a smaller amount as C. Clayton only forms part of the total wage bill.
The second change I will do is decrease the hourly rate by 50% so the hourly rate will change to £5.00 so the effect on the whole wage bill will be a decrease of 50%.
I will now change the data in the workbook. And I will screen dump the changed data.
Change 1
Change 2
My predictions were not correct because I got my data mixed up by having 2 percentages. C. Clayton’s 50% had an effect but as the change in overtime pay meant Clayton overall bill does increase by same percentage.
For the second change I was also correct because the wage bill decreased, but I did get the total wage bill wrong because it wasn’t 50% it was less, because I didn’t take in to fact the overtime pay so it became less. The original was £3156 and then after a 50% decrease it went to £1968.
Now I will change 1 of the formulas, the formula I will change is making a different contract. I will make the minimum hours less. It’s was originally 35 hours per week and I will now make this less so it is 30 hours per week.
The new formula would be: “ =B4-30 “
My prediction is that every employee will get more money because they will be paid overtime rate for more of their hours worked and the amount on overtime is 12 per hour. The wage bill will increase dramatically.
Without formula
With Formula
My predictions were correct because the overtime hours increase because the total wage bill increased a lot. So I was correct.
This still doesn’t compare to a real life situation data because the model doesn’t include any deductions. So I will include a new column with a Deduction of tax.
The tax I will deduct will be 22% of the gross pay which was the total pay. I will have to include net pay also because net pay means total after deductions.
Net pay will be 22% less than the gross pay. There will be a decrease the more the gross pay it is. So my prediction is that there will be a decrease in the net pay.
Without the formula:
With the formula:
My predictions were correct again because net pay is 22% less than gross pay, which is the last amount the employee receives, but if the school deducts other deductions then the employee will receive even less amount.
The model is still not up to strach because it doesn’t take into account all the deduction like National Insurance and pensions and so on. I think if all these deductions were included in my model the model would be suitable for a real life situation.
The different deductions were mostly the ones I put above. There were some other ones, which were corporation tax, Capital taxes and value added tax. If these deductions were added this model would compare to a real life situation.
There was a problem with my model and I spotted it during the changes. The formula for the standard pay is too simple to use for changes to the total hours and overtime because sometimes it would mean some people would be paid twice, so the new and improved formula would be:
= (B4-C4)*$B$12
Now I will change the old formula and put the new formula, which is the one above.
This now is the updated version with the new formula added so this would be suitable for the real life situation.
The next thing I will do is just to help check the average wage bill for an employee. Then I will include the maximum and minimum wage bill that should be given. This is very useful for an employer because it saves a lot of time to work it all out. I will work out the gross pay wage bill.
There will be 3 formulas I will need to use to work out minimum, average and maximum wage bill.
- =Min(f4:f9)
- =Max(f4:f9)
- =Average(f4:f9)
The cell f4 and f9 are the cells for gross pay for the employees. This will calculate the average for the gross pay and work out the maximum and minimum wage.