Equipment
- 2 different sized test tubes
- 3 different sized beakers (these and the test tubes represent different sized animals)
- 5 pieces of tin foil
- Kettle
- Water
- Thermometer
I have used 5 different sized variables to get a range of results so that I am able to compare them noticing if there are any anomalous results and I will be able to see if my theory is correct.
Method
- Work out the surface area and volume of each piece of glassware, and then work out the surface area to volume ratio.
- Boil water in the kettle, and then let the temperature drop to 80°C.
- Pour the water into a piece of the above glassware.
- Cover the top of the glassware with a piece of tin foil.
- Test with a thermometer after 5 minutes.
- Record results.
- Repeat using each piece glassware.
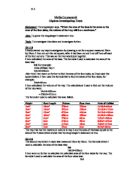
These vessels are arranged in order of size starting with the smallest.
To work out the surface area: volume ratio of each variable I did the following: -
- Worked out the volume using the formula: -
Volume= 2Л r² * h (2Л r)
- Worked out the surface area using the formula: -
(C * h) + (Л r²)
- I divided the surface area and volume by the highest common factor that they both share.
- This gives you the ratio e.g. I someone has £125 and someone has £75 they go into a ratio of 5:3. This is because their highest common factor is 25 so 125/25=5 and 75/25=3.
C= circumference, h=height, r=radius.
From my table of results I can see that my prediction is probably correct, the larger the surface area to volume ratio the more/quicker the heat is lost. I am now going to draw some graphs to make my results clearer.
I used a bar chart for my first graph and third graph because I decided that it would be easier to spot any pattern for this particular data and I already had a fairly good idea of what these graphs would show.
For my second graph, Graph to show heat loss of each vessel, I decided to use a line graph because I wanted to compare each result with the others.
From my first graph, Average Heat Loss of Each Vessel after 5 mins, I can see that most of the results follow a pattern that suggests that the larger the surface area to volume ratio the more quickly heat is lost. My second graph, Graph to show heat loss of each vessel, shows negative correlation. Each coloured line relates to the key and shows that again the larger the ratio the larger the heat loss.
There is one anomalous result this could be caused by several factors: -
- Misreading of temp
- Sudden wind/breeze
- Inaccurate timing
- Placing vessels in different parts of the room.
Generally all graphs show that the larger the SA: V ratio the quicker heat is lost, for example, when the SA: V ratio was 5:1, 20.4° was lost compared to when the SA: V ratio was 0.8:1 only 3.4° was lost. All the graphs relate to each other as they go down accordingly, excluding the anomalous result.
Evaluation
I don’t think the procedure went very well because before we started the experiment we didn’t think about all consequences such as placing the vessel in different places or moving them around the room. Also once we had carried out the procedure we realised that we should have tested the temperature at different time intervals rather than once after 5 minutes. This would have made the procedure more reliable.
Generally I did obtain the results I expected, even though I obtained one anomalous result. My prediction was based on my homeostasis, my prediction was correct when not accounting for the anomalies. Homeostasis is the maintenance of a constant internal environment, by balancing bodily inputs and outputs and removing waste products by an animal. The vessel represented the job of the skin in homeostasis (see planning).
Vessel three suggests that my prediction was incorrect but because I did the experiment with 4 other vessels, which follow a pattern, I decided this must be an anomalous result. It is probably likely that I miss read the temperature; if I did the procedure again I would double check the temperature reading. Also to improve the procedure I would double check my calculations, make sure there is no breeze and keep all vessels in the same place.
I don’t think the results are very reliable because there are a lot of things that could be improved with the procedure. I do think the results are fairly reliable as they are correct in theory.