Maths Coursework: The Fencing Problem.
Aim;
To find different patterns of fencing that will make the maximum area and I am going to find different shapes that will make this.
Working;
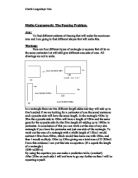
Here are four different types of rectangle or squares that all have the same perimeter but will still give different amounts of area. All drawings are not to scale.
In a rectangle there are two different length sides and they will add up to five hundred if we are looking for a perimeter of one thousand metres so each opposite side will have the same length. In the rectangle 450m by 50m the opposite side to 450m will have a length of 450m and the same goes for the opposite side for the 50m length all-adding up to 1000m in perimeter. In conclusion of this you can work out the area of any size rectangle if you have the perimeter and just one side of the rectangle. To work out the area of a rectangle with a width length of 150m I would subtract 150m from 500m, which would then leave me with 350m, and then I would multiply 150m by 350m giving me a total area of 52 500m2.
From this evidence I can put this into an equation. (If x equals the length of a rectangle.)
000=x(500-x)
By using the equation you can make a prediction table. (overleaf).
After 250m on each side I will not have to go any further as then I will be repeating myself.
Length (m)
Width (m)
Area (m2)
0
500
0
0
490
4900
20
480
9600
30
470
4100
40
460
8400
50
450
22500
60
440
26400
70
430
30100
80
420
33600
90
410
36900
00
400
40000
10
390
42900
20
380
45600
30
370
48100
40
360
50400
50
350
52500
60
340
54400
70
330
56100
80
320
57600
90
310
58900
200
300
60000
210
290
60900
220
280
61600
230
270
62100
240
260
62400
250
250
62500
From this table I can draw a graph to show the width against the area of a rectangle.
From the graph and the table it shows that the biggest rectangle is with a width of 250m and a length of 250m. This shape is also called a square. As I only recorded the results to the nearest 10m I am not completely certain that the graph and the table are correct so I will use 249.25, 249.5, 249.75 and 250 this will prove if all the results will fit on the line graph.
Aim;
To find different patterns of fencing that will make the maximum area and I am going to find different shapes that will make this.
Working;
Here are four different types of rectangle or squares that all have the same perimeter but will still give different amounts of area. All drawings are not to scale.
In a rectangle there are two different length sides and they will add up to five hundred if we are looking for a perimeter of one thousand metres so each opposite side will have the same length. In the rectangle 450m by 50m the opposite side to 450m will have a length of 450m and the same goes for the opposite side for the 50m length all-adding up to 1000m in perimeter. In conclusion of this you can work out the area of any size rectangle if you have the perimeter and just one side of the rectangle. To work out the area of a rectangle with a width length of 150m I would subtract 150m from 500m, which would then leave me with 350m, and then I would multiply 150m by 350m giving me a total area of 52 500m2.
From this evidence I can put this into an equation. (If x equals the length of a rectangle.)
000=x(500-x)
By using the equation you can make a prediction table. (overleaf).
After 250m on each side I will not have to go any further as then I will be repeating myself.
Length (m)
Width (m)
Area (m2)
0
500
0
0
490
4900
20
480
9600
30
470
4100
40
460
8400
50
450
22500
60
440
26400
70
430
30100
80
420
33600
90
410
36900
00
400
40000
10
390
42900
20
380
45600
30
370
48100
40
360
50400
50
350
52500
60
340
54400
70
330
56100
80
320
57600
90
310
58900
200
300
60000
210
290
60900
220
280
61600
230
270
62100
240
260
62400
250
250
62500
From this table I can draw a graph to show the width against the area of a rectangle.
From the graph and the table it shows that the biggest rectangle is with a width of 250m and a length of 250m. This shape is also called a square. As I only recorded the results to the nearest 10m I am not completely certain that the graph and the table are correct so I will use 249.25, 249.5, 249.75 and 250 this will prove if all the results will fit on the line graph.