When you compare my two cumulative frequency curves for boys and girls, you find that the students watch about the same number of hours of TV per week, which we can see from the different quartiles.
Box Plots
My box plots for number of hours spent watching TV by both girls and boys in years 7 and 9 show that their Q1’s are all extremely close, (either 10, 10.5 or 11 hours) apart from year 9 boys, which is 14 hours. Their medians are all between 10 and 20 hours but range from 18 hours to 13 hours, and their Q3’s are all between 20-30, but again are fairly spread out in the group as they range from 29.5 hours to 14 hours. Their lowest values are all very similar, but their highest values are very spread out, the highest being 74 hours in year 9 boys and the lowest 42 hours in year 9 girls. All of the year groups, both boys and girls show positive skews, as their medians are closer to their lower quartiles than their upper quartiles.
My IQ box plots for boys and girls in years 7 and 9 all had fairly similar Q1’s, which ranged from 97 to 99.5, and fairly similar medians that ranged from 101.5 to 105. Their Q3’s were slightly further apart ranging from 106 in year 7 boys to 111.5 in year 9 girls. The inter quartile ranges for girls and boys in year 7 seem to be extremely similar, apart from the boys seem to be a unit further down than the girls, i.e. the girls Q1 is 98 whereas the boys Q1 is 97, however their medians have only a 0.5 difference, the boys is 101.5 and the girls is 102. The inter quartile ranges for boys and girls in year 9 seem to be slightly higher, their Q1’s are 99.5 for the girls and 99 for the boys, and their Q3’s are 111.5 for the girls and 109.5 for the boys. However the boys and girls in year 7 have higher “lowest values” and higher “highest values” than the boys and girls in year 9 do, e.g. the year 7 girls lowest value is 75 and their highest value is 140, compared with the year 9 girls’ values, which are 70-125. This suggests that even though the year 7’s inter quartile ranges are slightly lower, they may have cleverer students than the year 9’s. All of the year groups, both boys and girls have positive skews apart from year 7 boys who have a symmetrical distribution.
Scatter Graphs
My scatter graph showing the relationship between IQ and number of hours spent watching TV per week in year 7 girls unfortunately didn’t show a positive or negative correlation, which makes my hypothesis incorrect. It showed that even a girl who watches the most TV in her year (around 50 hours), can have an average IQ which someone who watched 40 hours less also has. The girl who has the highest IQ watches just as much TV as the girl who has the lowest IQ.
My scatter graph for year 9 girls shows that there is no correlation therefore no relationship and also no average. The girl who has the lowest IQ (around 71), watches just as much TV as a girl who has one of the highest four IQ’s (about 112).
My scatter graph for year 7 boys, shows that the average number of hours spent watching TV per week was around 10-20 hours, but that there is again no correlation, and no average IQ, the range is from about 76 to 110.
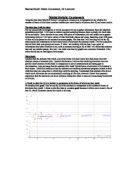
My scatter graph for year 9 boys also has no correlation, showing no relationships. Even though there is one clear sample which supports my hypothesis and that is a boy who has the lowest IQ, about 73, and who also watches the most hours of TV per week, about 75 hours. This was the most TV watched apart from one boy who watches about 150 but as this number is so high I think this may be an anomaly as most people watch between 0-40hours of TV.
Histograms
My histogram is for year 9 boys IQ’s. This shows that the highest frequency was between 94.5 and 104.5 and that 16 boys were in this group. The second highest group was between 104.4 and 114.4 and 11 boys were in this group. The group with the lowest number of boys in it was between 74.5 and 84.5, which only had one boy in it.
Grouped Means
The way I worked out my means was by:
- Adding up all the samples
- Dividing them by the number of samples
To save time I did these calculations on the computer by:
- Clicking on the cell I wanted the answer to be in,
- Pressing =
- Highlighting the column of samples
- Pressing AVERAGE and then enter.
The means for number of hours spent watching TV were all very similar, (either 18 0r 17 hours) apart from year 9 boys which was 24 hours. For IQ the mean for all the year groups, both boys and girls were all around 100-103. To get a more precise mean I could have done exactly the same but with a much bigger group of samples, for example 50-100 from each year.
Grouped Mode
To find my modes I used a tally chart, and counted up the group with the most entries in it. For this I discovered that all the modes for number of hours spent watching TV were all either 10 or 11 apart from the year 9 boys, which was 20. For IQ’s I again found that they were all very similar ranging from 97 to 103. To make my results even more accurate I could have chosen to do a bigger sample.
Grouped Range
The ranges of number of hours spent watching TV per week were all completely different, year 9 girls was 39 whereas year 9 boys was 168. This shows that in some year groups pupils watch much more than others. There are some extreme cases, such as in boy’s year 7 a pupil watches 170 hours a week. The ranges of IQ’s are also fairly different ranging from 32 in year 7 boys to 44 in year 9 boys.
Conclusion
In conclusion I have found that hypothesis 1, is incorrect as there is no relationship between the number of hours spent watching TV and IQ. I might have found one if I have used more samples from each year group, so if I decided to re-do my investigation I would instead use between 50-100 pupils from each year group. I found a few pupils who fitted into my hypothesis which included a boy in year 9 who’s IQ was about average, 101, but who watched the most amount of TV, 170 hours per week.
Hypothesis 2, I found to be correct with girls as the girls in year 7 watched more TV than the girls in year 9, this can be clearly seen in my box plots where their inter quartile ranges go from 11-29.5 leaving a difference of 18.5 compared with 10-26.5 leaving a difference of 16.5 in year 9 girls. I found it to be incorrect with boys as year 9 boys watch more TV than year 7 boys and this can be shown clearly in my cumulative frequency graph as the highest value for the year 7 boys is 60 hours compared with 100.5 hours in year 9 boys. The theory that I based hypothesis 2 on was that younger people/children normally have more spare time as schools don’t give as much homework to younger children and they could therefore watch more television. My theory was proved correct with girls but not with boys. This may be because boys might prefer to play sports than watch TV and would spent their free time participating in activities such as football or rugby, and although this could be a sexist comment it is one possibility. To investigate my hypothesis further I could expand on the age range and instead of only investigating two year groups I could study 3 or 4.