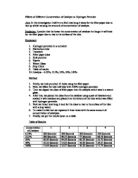
Method used is almost identical as before, with the only differences of CaCO3 ground into fine powder and weigh accurately to 5g contained within a beaker.
Results 2
Analysis 2
These results seems a lot more promising than the last, they are not too slow or fast and I can see straight away if I plot mass loss on a graph it shows a curve. But would it be too slow for 0.4 moles, the lowest concentration use in the main experiment, to find out another experiment has to be carried out.
Dilute 10cm3 of 2.0M HCl with 40cm3 of water to create 0.4M HCl.
Results 3
Analysis 3
At the start it was alright but towards the end it was a bit slow. I decided to another experiment with the amount of calcium carbonate reduced and see if it would create greater differences in mass loss.
Reduce the quantity of calcium carbonate to 2.00g.
Results 4
Analysis 4
Reducing the amount did not create greater differences but smaller. In theory increasing the amount of calcium carbonate would create greater differences in mass loss.
Increase the quantity of calcium carbonate to 2.00g.
Results 5
Analysis 5
My theory was wrong; increasing the mass of calcium carbonate did not create big differences either. I am going to stick with 5g and by using a more accurate electrical weigh that can measure up to 3 decimal places would solve the problem.
Conclusion
I have decided the most appropriate mass of calcium carbonate to react with; highest concentration of 2 molar and lowest concentration of 0.4 molar hydrochloric acid, is 5g.
The preliminary experiments have given me ideas to improve on the main experiment; calcium carbonate is ground to powder form, using an electronic weigh that can measure up to 3 decimal places, measure acid more accurately by using a burette and also when I was doing the preliminary experiments I notice the reactions often splashed out some acid, that could make the results inaccurate because mass is loss when acid is spilt, so on the main experiment the reaction will be carried out in a conical flask instead of a beaker and with cotton wool acting as a plug to stop acid splashing out, but at the same time allowing carbon dioxide to escape.
Main Experiment
Hypothesis
Reaction rate and the concentration of acid are proportional, so reaction rate will increase with the acidity of acid.
Apparatus
- Conical Flask
- Cotton Wool
- Burette
- Electronic Scales (measuring up to 3 decimal places)
- Timer
- 2 Molar Hydrochloric Acid
- Beaker
- Calcium Carbonate (fine powder)
Diagram
Method
-
Grind CaCO3 into fine powder.
-
Place beaker on weigh then press ‘tare’ so reading returns to 0, then weigh out 5g of CaCO3 in the beaker
-
Pour i) 50cm3 of 2M HCl Concentration – 2.0 M
ii) 40cm3 of 2M HCl dilute with 10cm3 of water – 1.6 M
iii) 30cm3 of 2M HCl dilute with 20cm3 of water – 1.2 M
iv) 20cm3 of 2M HCl dilute with 30cm3 of water – 0.8 M
v) 10cm3 of 2M HCl dilute with 40cm3 of water – 0.4 M
into the burette.
- Once concentration of acid is correct pour into a conical flask.
- Place the conical flask with a bit of cotton wool (enough to be used as a plug) on the weigh.
-
Put CaCO3 in acid, then press ‘tare’ so reading returns to 0, start timer simultaneously.
- Record reading for every 5 seconds.
- Stop once 10 readings have been obtained.
- Repeat to obtain another set of results.
N.B. Safety goggles must be worn during experiment and be careful with hydrochloric acid.
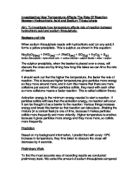
Theory
A reaction will only take place if the two particles collide with sufficient force to break the bonds of the reactants, so new bonds can be formed. When breaking bonds, energy is taken in so it is endothermic; whereas forming bonds give out energy so it is exothermic. The minimum force required to break these bonds must be higher than the activation energy of the reactant; only a certain proportion of collisions will have this necessary energy. Other particles collide without enough energy would not result to a reaction. Energy can be put in by heating the particles. The activation energy can be lowered by adding a catalyst (as graph shown below).
A catalyst is a substance which speeds up a reaction by lowering the activation energy; this means the proportion of collisions, which will have enough energy to overcome the activation energy has increased. At the same time the catalyst is chemically unchanged, which means it can be retrieved at the end of reaction. In common reactions, transition metals and their compound are good catalysis.
Also for a reaction to occur, the colliding particles must be lined up with the correct orientations. In this way the particles can exchange places, forming new compounds.
Effect of concentration on reactions
Higher concentrated acid react faster then more diluted acid. This is due to higher concentrated acid has more reactant particles (H+ in hydrochloric acid) in a certain volume. More reactant particles mean more collisions, which gives a greater chance for the particles to collide with force greater than the activation energy and line up in correct orientation, result in more reactions.
Effect of temperature on reactions
Increasing the temperature increases the reaction rate. This is because more energy is given to the particles, so that they move faster, colliding more frequently result in more chance for a reaction to occur. Also the energy given has the effect on greater proportion of collisions to overcome the activation energy.
Effect of surface-area on reactions
If surface area increases, so will the rate of reaction. When surface area is increased (e.g. by cutting object into smaller pieces) more particles is exposed at its many surface, more reactant particles can react at the same time therefore reaction rates increases.
Results
Temperature of reactions was kept at 25°C throughout the experiments.
Graph 1
Graph 2
Graph 3
Graph 4
Graph 5
Graph 6
Analysis
The results show that the concentration of acid does affect the rate of reaction. From the graph we can clearly see, the top line represent the acid with the strongest acid and the lowest line represents the weakest. I can draw a conclusion that the concentration of acid is in proportion to rate of reaction; higher the concentration quicker the reaction rate, as I have predicted in hypothesis. This is because the concentration has an positive effect on the rate of reaction (refer back to p.7 Effect of concentration on reactions).
The lines on the graph are curved, steep at beginning and gradually level out. When calcium carbonate was put into the acid, the rate of reaction increased quickly at first, then it gradually slowed down and if the experiment was carried out longer, the reaction would have stopped. This is because when calcium carbonate was first added to acid, it had the most surface area, so it reacted fastest at start. Then the surface area and amount of calcium carbonate was reduced as it was reacted to form calcium chloride. Also the acid was most concentrated at first then was slowly neutralised, as a result reaction rate slowed down.
It would eventually get to the point where all calcium carbonate has reacted with acid or all acid has been neutralised, the rate of reaction would then stop completely. If same amount of CO2 is produced, this means all equal quantities of calcium carbonate have all been reacted. Whereas if different amount of CO2 is produced, shows all acid has been neutralised, because it shows that some calcium carbonate remain unreacted. Graph 1 confirms that all acid has been neutralised in these experiments, because they stop at different amount of CO2.
Gradients
To see if the concentration of acid is in ratio to the rate of reaction and if a pattern exists, I am going to work out the initial gradients of all five concentrations.
I predict there would be a direct positive relation between the five initial gradients. I have predicted this because the concentration should have a direct effect to the rate of reaction. For example, 2.0M acid gave 5 times as much gas as 0.4M, in the tables of results we can see the gas produced by the two concentrations 1.4020: 0.3205 is approximately in the scale of 5:1.
Formula for working out the gradient
(All to 3 decimal places)
We can see that at the start, the line is increasing constantly in a near straight line, but then it has suddenly levelled off almost completely. I cannot identify this point at 2.0M as a mistake or it is meant to be in this way. It could be caused by slow at taking the first reading or in a more unlikely situation where any concentration higher than 2.0M would just remain at that level. To find out more we would have to improve our experiment (see Evaluation). However we can definitely see that the concentration forms a positive relation with initial gradient, which with a higher concentration of acid has a greater initial gradient.
Evaluation Results obtained matched my hypothesis and scientific theory, so I believe my method was reliable. I also repeated the experiment twice and both sets of results are closely matched, showing it does not vary much; I took the average of the two and drew an accurate line graph fitted with lines of best fit.
I noticed when I repeated the experiment; the results were quicker than the first set of results by a fraction. This could be caused when I used a different bottle of hydrochloric acid after the first one was used up; the second bottle could be slightly more concentrated than the first, consequently the reactions were slightly quicker.
There is an anomaly on the graph, line 2.0M the third point is slightly higher then where it should be. This error could have been done if I have misread the digits on the scales, late at taking the reading, movement of table or other environmental factors.
I can conclude from this experiment that higher concentrated hydrochloric acid reacts faster with calcium carbonate. As the graphs are shown higher the concentration, less time it takes to reach high up on the graph. The graphs also show all the different concentrated acid has been neutralised, as they all level out at different heights, which also tells us more concentrated acid react with more calcium carbonate.
I could improve my method by using same concentration of acid. In analysis, there was an unknown trend caused by the 2.0M point. To improve this I would extend the experiment with larger range of concentration. And also the first reading is the most important, so if we decrease the surface area of the reactant, instead of using grid up calcium carbonate, we can use uniformed size digestive tablets, which react slower we can be more accurate or use less concentrated acid. Further more I could have carried the experiment in a water bath as a temperature control for a more accurate measure, as this reaction is an exothermic reaction the temperature would increase slightly, this can cause the rate of reaction to increase, affecting the results. By including a temperature control, the temperature would be constant and so only the concentration of acid would affect the reaction rate.
I could support my conclusion by carrying out other experiments, reacting different concentrations of acid with different metals or metal carbonates to see if they all have same trend lines and behaves in similar ways.