Material of Wire
If the material being used contains atoms with a large number of electrons on the outer shells, then this means there are more electrons available. So, in theory, if the material has a large number of atoms, there should be less resistance, because of the higher number of electrons .If the atoms in the wire are closely packed, then this will cause an increase in resistance, due to frequent collisions.
If I wanted 2 do this I would use the same length and width of many different wire materials, using the same amount of voltage each time.
I will be keeping this variable constant by not changing the wire as so to keep the experiment a fair test.
Length of Wire
The longer the wire, the longer it will take electrons to get to the end of the wire. This is because there will be more collisions between electrons and atoms. So, in theory, the length of the wire should be directly proportional to the resistance.
I will be changing the length of the wire, as this would be very easy to do, and give accurate results. Because of the length being proportional to the resistance, I could link the length of a wire with the resistance of the wire, which would make my graph more interesting.
Diagram
The following circuit was constructed to perform the investigation:
Apparatus
- Wire
- Ammeter
- Voltmeter
- Power
- Resister
- Pointer
- Over 100cm Constantine wire (resistance wire)
- Ruler
Method
- Just over one meter length of “constantan” (a metal alloy) wire is fixed to a metre rule.
- The pointer is attached to the wire at the 0cm position on the metre rule.
- The pointer is then placed to the relevant position depending on the required length of wire (stated later), which is measured against the ruler.
- The power supply is turned on. The voltage and current are then read off the ammeter and voltmeter, and recorded.
- The power supply is then turned off and the pointer is moved to the next position.
- From the readings of the current and voltage we were then able to work out the resistance.
The above steps are completed for each length and then the entire investigation is repeated twice for accuracy.
Fair Test
In order to look at fair testing we need to consider the variables. I have stated about four of the variables, which will be kept constant throughout the experiment (see above) except the length of the wire, as this will be what I will be changing.
- Letting the wire cool down sufficiently in between readings. When the wire heats up, it has lots of energy, which causes the atoms in it to vibrate, making it harder for the electrons to travel. This increases the resistance via another method.
- The same battery must be used throughout as different batteries may have different voltages if they are old.
- I must ensure that I measure out the right length.
- The wire must be pulled tight against the ruler and taped in place to ensure the length is accurately measured.
- The experiment should be repeated 3 times and an average taken to make sure that the results are reliable.
Predictions
I predict that the resistance of the wire will increase as the length increases because the longer the wire, the more times the free electrons will collide with other free electrons, the particles making up the metal, and any impurities in the metal. Therefore, more energy is going to be lost in these collisions (as heat), (this is shown in the diagram below).
Quantitive Prediction
Furthermore, as ohms showed doubling the length of the wire will result in double the resistance. This is because by doubling the length of the wire one is also doubling the collisions that will occur, thus doubling the amount of energy lost in these collisions.
Safety
In order to perform a safe experiment I will:
- Use a low voltage of 4.5V so that that the chance of the wire overheating was reduced. Furthermore, lengths lower than 5cm were not tried, which also helped to avoid overheating.
- Ensuring that I take basic precautions by not allowing water anywhere near the experiment so not to cause the risk of an electric shock. Also not to stick fingers in sockets etc.
Precision
I will take as many different results as possible so that there a wide range of results and that I am able to arrive at a good conclusion. To increase the accuracy of the experiment I will do repeats for all the experiments so when the mean is taken, an accurate table is drawn up and if one result is anonymous the other two results would contrast the anonymous result. I will also use a pointer because they are a lot more accurate, because they have a smaller surface area on their tips than crocodile clips. This in effect would give much more accurate measurements.
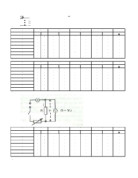
Above is a table of how I am going to record my results.
The length will increase in 5cm intervals up to 100cm. All together, there will be20 measurements. The voltage and the current will then recorded accurately and accordingly, and from those results the resistance will be obtained. The resistance will be calculated by dividing voltage by current. As you can see from above the length will be measured in cm, the voltage in volts, the current in amps and the resistance in ohms.
I believe that my table of results shall be very accurate because I have chosen a reliable amount of measurements, and am going to repeat the experiment 3 times and average them, in order to confirm the measurements. I will be taking great care in recording my results by:
- For every interval in length, I will record the currant and voltage read off the voltmeter and ammeter (which will be digital to allow accuracy of the readings)
- Once all data is recorded, I shall calculate the resistance by dividing the voltage by the currant.
- Once the resistance is recorded, I shall average the results. Calculating across the table, by adding all the first measurements of 5cm from all 3 experiments and then dividing by 3 to get my average. I will then repeat this for all my measurements up to 100cms.
Bibliography
All sources I have used have been from:
- ‘Physics For You’ by Keith Johnson
- My own notes from previous lessons.
Obtaining Evidence
Results
Experiment 1
Experiment 2
Experiment 3
Averages for the results of the experiment were then calculated to give these results, which were then graphed.
Average Results
I produced a full set of results including averages of the three experiments that I carried out, with no anomalous results and recorded each result to two decimal places.
Analysing and Considering Evidence
Conclusions
Having performed the investigation, the following conclusions were drawn:
- As predicted, an increase in length resulted in an increased resistance. This can be clearly said for both wires tested.
- Both wires show a strong trend of a straight line, i.e. the length of the wire is shown to be directly proportional to the resistance – double the length and the resistance doubles.
-
The overall resistance of the two wires seems to differ considerably. Due to the strong correlation of the results, the explanation of this is unlikely to be the method used to obtain the results. The more likely explanation would be that the first wire was actually of a larger diameter than the second one. Obviously this is a rather important oversight and this will be discussed more in the Evaluation section. The reason why this is the likely explanation is because resistance is known to be inversely proportional to the cross-sectional area, i.e. if you increase the cross-sectional area (by increasing the diameter) then you decrease the resistance. This is because a wider wire means less likelihood of the free electrons having collisions and losing energy.
It is important to realise, however, that despite the fact that it would appear that the resistance of wire 2 is double that of wire 1, that does not mean that the diameter is half that of the wire 1. That is because if you halve the diameter then you decrease the area by a factor of about 3 (A = πr2)
Evaluation
- As mentioned previously, the biggest downfall of the investigation was the apparent mistakes when choosing the wire, in that they would appear to be of differing diameters. This did not, in this case, cause a big problem as the same wire was used for each set of results so it is known that the results for each wire are correct.
- Generally speaking, wire 1 would appear to contain the most accurate results due to the fact that all of its points bar one sit on the line of best fit for that wire. The only one that does not is the point at 90cm, which was exactly at the point that the black mark (mentioned previously) was found to be.
- Wire 2, on the other hand, had three main anomalous results: at 50, 80 and 90cm. They are by no means that far off but in an experiment such as this, which is generally a very accurate one anyway, such anomalous results should not be quite so common. Possible explanations for these anomalies are as follows:
- The length of wire for that particular measurement was not correct. At 50 and 80cm it is possible that the length was shorter, causing a lower resistance, and at 90cm it is possible that it was longer, causing a higher resistance. The solution to this is to measure the lengths more carefully and ensure that the wire is pulled tight against the metre rule.
- For a particular result, one or more of the connections could have been faulty, causing extra resistance at the connections. A solution to this would be to, before each experiment, connect the connections together without the wire in place and measure the resistance then. If it is higher than it should be then the connections could be cleaned.
- Whilst extremely unlikely, it is conceivable that the power supply was providing a different voltage for some of the results. This is unlikely to be a problem in this investigation but it might have been an issue had we used batteries instead.
NB: If one were to assume that Ohm’s Law applies, then another possible explanation could be that at some points (more likely in the lower lengths), the wire was not allowed to cool completely so that the temperature was higher for that measurement. Whilst unlikely (due to the two sets of results), this would cause a higher resistance as explained previously. However, it is now known, after researching the metal alloy “constantan,” that the resistivity (the electrical resistance of a conductor of particular area and length) of this alloy is not affected by temperature. Therefore, in these experiments Ohm’s Law does not apply.
From my graph, I can see that my results were accurate. All the points are very close or on the line of best fit in a positive correlation. There were no anomalous results.
As I obtained accurate results, I think that the method I used was suitable.
However, there are certain improvements I could make to improve the accuracy, namely:
· Making sure the wire is straight so measurements could be taken accurately.
· Making the wire straight would enable more accurate positioning of the crocodile clips, which again would give more accurate results.
· Letting the wire cool down sufficiently in between readings. When the wire heats up, it has lots of energy, which causes the atoms in it to vibrate, making it harder for the electrons to travel. This increases the resistance via another method, so it is not a truly fair test.
All the other variables I have stated apart from the length of the wire must remain the same throughout the experiment, (see above).