- Lengths and widths of wire to use to help give us a broad range of results and help us produce a valued conclusion.
- Input power to use, as to get reasonable results without always burning out the wire or producing sufficient heat to disrupt results.
- How to carry out a safe and well thought through investigation.
From the pre-test we decided to work with a 2 volts input on a D.C current, with lengths ranging from 10-40 cm and widths of 0.3mm to 0.7mm.
Diagram
Method
- Set up equipment as shown above in diagram
- Choose decided width and length
- Put power pack on 2 volts D.C and clip wire to complete circuit
- Take readings from each test when passing current through chosen width and designated length of wire.
- Test each length and width 3 times
- Repeat experiment with other lengths and widths
Fair Test
To keep it a fair test we tried to do each experiment in the same conditions, using the same wire as previous tests and not changing power packs. We made sure we always used the same equipment as within different appliances discrepancies can occur.
Safety
Whenever working with electricity you have always got to be careful. We made sure never to use equipment which was faulty or not in good condition. When testing we had to make sure the wire wasn’t tested for too long or at a short distance as this would occur in a burn out of wire and produce excessive heat which could entail be harmful. Whenever testing, no one was to touch the wire or equipment.
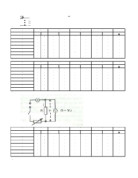
Results
Graph
Analysis
As you can see my prediction was right on one hand but not on another, as the length of the wire got bigger so did the resistance. You can tell this between lengths easily between the sets of data for a single thickness experiment. Take 0.70mm as the length of test increases, therefore so does the resistance produced. This can also clearly be seen in the graph. This is because as the length gets bigger the P.D and current need to do the same to keep up with demand of space (P.D or voltage is the electronic pressure which drives electrical charges round the circuit, this needs to increase to keep the charge. Current is the flow of charge and therefore increases with the increasing P.D.)
When it comes to thicknesses we can see something different;
As the width gets bigger we can see a decrease in resistance. This is because as the wire is bigger, there are more electrons to carry the charge with more space to move; therefore the resistance against the current isn’t so high.
Evaluation
Overall I think the experiment was a success and gave me the results I needed to produce a good and conclusive analysis and final conclusion, although they may not of been overall 100% correct or accurate. This can be seen from the graph, as in theory it should have been a straight line. This could be because of a matter of things including;
- Temperature changes in wire (this can severely disrupt resistance patterns)
- Dubious equipment
My 0.30mm thick wire was clearly my best investigation, with the nearest to a straight line of all of them, which could be surprising as the smaller ones would be expected to be affected by heat more.
Even though I received these slight discrepancies I feel the investigation was an overall success.
If I were to do it again, I may look at furthering my investigation and only concentrating on widths. I may also go towards using better quality wire and testing in more controlled conditions to try and eliminate the severity of effect of heat on investigation.