Lengths: original length-20.5cm, 18cm, 15cm, 12cm, 8cm, 5cm.
Widths: original width-7.6cm, 6.6cm, 5.6cm, 4.6cm, 3.6cm, 2.6cm.
I chose these because they cover a good range.
To make it a fair test I will use the same apparatus throughout the experiment to ensure accuracy. I will also repeat my results to check there are no anomalous results. The thickness of the carbon paper will also be kept constant otherwise the electricity will flow easier if it is thicker as there is more room for the electrons to move through. I will also use the same wires throughout.
When I collect my results I will display them in a table similar to the ones over leaf:
I must keep all variables apart from width and length the same to ensure a fair test. For example, the thickness of the carbon paper must be the same throughout along with the equipment I use, especially the wires.
I predict that resistance in my circuit that I will set up will follow similar rules to that of the resistance in wires.
For example, I think the wider the carbon paper, the lower the resistance and vice versa. This will be because when the power supply is turned on, the same flow of electricity will be trying to flow through the wider piece of carbon paper as it would be through the carbon paper with a decreased width and there will be more room for the electrons to move through and there will be less collisions between them, so the electrons don’t need much energy to be able to flow through the paper.
When I shorten the length of the carbon paper I think that the resistance will drop. I think this because when the paper is longer there will be more collisions. Whereas if the paper was shorter there is less room and so therefore there will be less collisions between the electrons and ions, resulting in less resistance.
I think that when I plot my graphs they will look similar to those below:
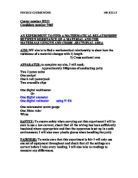
Safety
I will make sure I use a suitable supply of power going around the circuit so the wires do not burn. I will also turn the power off when I am not using it and make sure all connections are safe.
I chose my range of lengths and widths because that was as much as I could alter them within reasonable amounts and because the widths I use start off reasonably small so I had to increase it by very small intervals to still get a good range of results. I chose the range for my length because the length is unlimited so I can change that by about 5cm a time
Results
From my results you can see that as I increased the length of the carbon paper, the average resistance increased. This agrees with my earlier prediction. As the length increases the electrons need to travel further and so they loose more energy and need more energy to get through and this explains the increased resistance. Also as the length increases there is more collisions between electrons and ions than there would be if the paper were shorter
From looking at my table of results and graph I can see as I increased the width of the paper the resistance dropped because an increase in area means fewer collisions and so electricity can pass more easily through it and there is less resistance. The electrons have more space and so encounter fewer atoms. I have shown this in the diagrams below:
My results do match my earlier prediction as I predicted the results would follow similar rules to that of the flow of electricity and resistance in wires and this showed in my results.
I also plotted a graph from the table below showing 1/R V Width
My results form a smooth line when plotted in the form of a scatter graph but does not pass through the origin (0,0). I expected the line to pass through approximately (0,0) because when the width of the carbon paper is 0cm, then there would be no current passing through it and so theoretically there would be no resistance, but this does not show on my graph. Firstly I put this down to human error but I then realised the points followed too much of a pattern for this to be the reason and so I have discovered that this graph is one big anomaly. Because this graph failed to pass through the origin I decided to plot 1/width V Resistance in hope this would turn out better. As you can see from this graph the line still does not intercept the y-axis at nought. The only reason I can use to explain this is the resistance already present in wires and connections for example are causing the relatively high resistance where there should be none. The anomalous results pointed out on my graphs can be explained through human error. One of the clips may have been loose, causing the connections to be faulty or I may have read the reading wrong as the point is not greatly off the point it should be at. From this I can say that to improve my results I could have been more careful when attaching the wires to the carbon paper. The anomalous point on the Length V Average resistance is too low to fit in with the trendline. This can also be explained by human error as the clips may not have made a completely reliably connection with the paper.
To improve our experiment I should have collected more results and taken the average again as then my results would have been more reliable even though I did already do repeats. Other ways to improve my experiment include measuring the carbon paper more accurately. Using a centimetre ruler to measure it may not have given me the exact length of paper I wanted, perhaps I should have used a ruler with smaller readings on and an extremely sharp knife to cut it instead of blunt school scissors.
To extend my experiment I could investigate how other factors effect the conduction of electricity in carbon paper. For example I could investigate whether temperature has any effect on it. I could subject the carbon paper to different temperatures using a heater and then a cool fan, and take a reading of the resistance to see if/how it affects it.
I could also investigate in to using different metals other than carbon to coat the paper in and then see how if affects the resistance.
In conclusion I can say that the conduction of electricity in carbon paper does follo