The temperature is also another factor which can effect the investigation. If the wire is heated up the atoms in the wire will start to vibrate more rapidly. This will cause more collisions between the free electrons and the atoms as the atoms also move into the path of the electrons. Increased collisions mean an increase of resistance.
The thickness of the wire is another contributor. The thicker the wire the less the resistance and the thinner the wire the greater the resistance. If we look below at the diagram:
If we look at the smaller circle which is representing a thin wire it is showing us that the electrons coloured as red have little space to move about and will collide more with the wire, creating greater resistance. However if we look at the bigger circle i.e. thicker wire and the electrons it tells us that they have a bigger space to travel through and less collision will take place creating lower resistance.
Prediction:
As the length of the wire increases the resistance will increase. This is because the electrons have a higher chance that they will collide more with the lattice of atoms of the wire, therefore creating a higher resistance for the overall current to go through. The thickness of the wire will effect the current flow, but this prediction is still valid because it does not matter how thick or thin the wire is, longer the length higher the resistance.
Ohms law which the resistance formula comes about (R = V/I) is also necessary to discuss. Ohms law states that for a particular metallic conductor, the current is directly proportional to the voltage provided the temperature remains constant. The current, the voltage and the resistance of a conductor are related by the following equation:
Voltage (V) = Current (A) × Resistance (Ω)
This defines resistance. For Ohmic conductors the resistance is constant and Ohms law of proportionality holds. This means that after I have done my investigation I should get graphs which are proportional (Y = X) i.e. as the length increases, resistance increases.
Method:
To start this experiment I first collected the correct equipment. The equipment that I used is as following:
- Crocodile Clips
- Ammeter
- Voltmeter
- The wires that were going to be tested, nichrome and constantan
- Battery pack
- A base where the wires will be placed upon to measure the resistance
- Wires (i.e. used with crocodile clips)
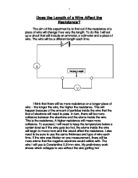
After collecting the equipment we then set up the experiment. Below is the diagram which shows how the investigation looked like:
This diagram can be drawn simply as the following:
During the investigation we kept all the variables constant except for one, the thickness. I used in total five thickness of five wires where two wires were constantan (0.18 mm and 0.30 mm) and nichrome (0.46 mm, 0.55 mm and 0.69 mm diameter). In the thickness of wires I did see a significant difference. As the thickness increased of both wires the resistance decreased. This is because the thicker the wire more the (current) electrons have a wider space to travel so they will collide less often with the atoms with the wire like it would do in a thin wire.
In total we took five measurements of the five wires. However in these five measurements we repeated our experiment three times each for each cm measured, for each wire. There are reasons on why I repeated our experiment three times each. Repeating the experiment three times each would mean that I would have got rid on any error on the previous measurement such as that measuring 10.2 cm instead of 10 cm meaning an error of 0.2 cm. repeating the experiment three times would result to the results being more reliable. Repeating the experiment would mean getting a better average for the overall results. After obtaining the results I inserted them into tables and graphs. The results for the nichrome wire are on fig 1 and the graphs are fig1a, fig 1b and fig1c. The results for constantan can be seen as fig 2 and the graphs as fig 2a and fig 2b.
During the investigation safety was enabled. We as a group were aware and understood what consequences would follow if the rules were violated. We said that as we were handling electrical equipment we not have wet hands and we would make sure if we would not burn ourselves due to the wire heating up because of the increasing resistance. To be economical and save money I never cut the wires. I wrapped the wire around one end of the base, pulled out 100 cm of it and wrapped it around the other end leaving the wire on its roll so when finished with the experiment I could easily roll it backup again.
Results:
Nichrome: Fig 1
Table 1.1 corresponds to graph Fig 1A
Table 1.2 corresponds to graph Fig 1B
Table 1.3 corresponds to graph Fig 1C
Constantan: Fig 2
Table 1.4 corresponds to graph Fig 2A
Table 1.5 corresponds to graph Fig 2B
Conclusion:
Looking at my graphs we can clearly see the general patter that as the length (CM) increases the resistance increases. This corresponds to all my graphs. If we look at fig 1a for example the graph line and the line of best fit show that as the length increases the resistance increases. For example at 0 cm the reading was 0.14 Ω at 50 cm the reading is 3.79 Ω and at 100 cm the reading is 7.42 Ω. These are average results and we can clearly see that they progress greatly proving my resistance correct. Also from the graph I can conclude two objectives, firstly my prediction is correct and also the ohms law of proportionality has worked. We can see that has worked because the line is running through approximately y = x and this accounts for the rest of the graphs as well. This means that my prediction was correct. As the length increases the resistance increases. This is because the electrons (current) have to travel further and will collide more with the lattice of atoms of the wire compared to a shorter wire where the electrons will have shorter distance to travel and will collide less often wil the atoms of the wire. Thickness was also noted. Thicker the wire, more the resistance. If we look at the following diagrams:
We can see that as the wire thickens the electrons have more space to travel through the wire and collide less often with the atoms of the wire causing less resistance. This is why in my results you can see that as the diameter of the wire increases the resistances decreases and as the wire gets thinner the resistance decreases.
Evaluation:
My experiment worked very well. The results are extremely reliable as I did the following test to prove they were right.
Resistivity = Resistance times cross sectional area / Current
Ρ = RA / I
Resistivity of nichrome = 100×10-8 = 0.000001
Resistance used 2.96 (Average result from a 0.69 mm diameter wire at 100 cm)
Cross section area = Pi × radius squared
Current = 0.44
2.96 × 0.373928065 / 0.44 = 2.515516078
Minus the answer by 0.000001 = 2.51551507
This tells that there is a difference of 2.5 ohms which is a very good difference as the difference isn’t exceptionally large.
After testing my results I can conclude to that my results are reliable and hat the investigation was successful. There were not any errors as such but could have been easily caused. The wires could have been faulty resulting to the current not being carried fully and the correct current going through the wire. The ammeter might not have been accurate which could account to the voltmeter as well. Another major error that could have been made easily was measuring precisely. Instead of measuring the voltage at 20 cm I could have accidentally measure it at 20.2 cm not noticing the mistake. This would have lead to differed results. However to overcome such an error I did repeat the experiment three times each. I repeated the experiment three times perhaps repeating it six times each would get me a better average.
If I was to do the experiment again I would firstly use a power supply instead of a battery pack. This is because with a power supply you are getting an accurate amount of electricity supply rather than a battery pack because when I increased the length the voltage increased meaning power of the batter reducing. Instead of using two types of metals I could have used 4 types of metals meaning a better comparison between the four rather than two. We could use the type of metal as a selected variable to see how the resistance occurs over that. If I was to redo the experiment then I would use a straight wire rather then a bendy wire. This is because in our experiment the wires that were being tested were not exactly straight rather bendy which could be clearly seen. Next time I would use a straight wire which would enable a straight flow of current rather then a bended wire where resistance is higher. Generally I know that this experiment was very good as my results show this.