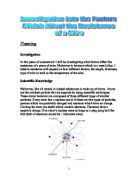
The above graph shows that as the length of wire increases, so will the number of atoms/collisions; and if the number of collisions increases so will the resistance.
The diagram above shows that the longer the wire, the longer, and more obstacle filled the path that the electron has to take is.
As I mentioned before the collisions an electron has with the atoms is the cause of resistance. So this should mean that as the length of wire increases so should the resistance.
Wire Thickness
If one electron had to pass through a single unit cell then it has one path to travel through but should several unit cells join together then that one electron has now several possible unit cells to travel through. So as the thickness of wire increases so does the possible routes the electrons can take so the number of collisions should actually go down. So the resistance is inversely proportional to the thickness of the wire.
As you can see in the diagram above, by increasing the length, the electron has more different paths to take so theoretically the number of collisions should go down, which also means the resistance should drop.
The graph above shows what should happen if the thickness is increased; the resistance drops.
Wire Type
As I have said before there are many different types of unit cells out there. Now if an electron has to pass through a simple cubic unit cell there are four electrons to hit, but it that electron then has to pass through an orthorhombic face centred unit cell which has fourteen atoms then the chances of a collision go up significantly. Therefore the type of wire has a large affect on the resistance of the wire.
As you can easily see in the pictures above the simple cubic unit cell has far less atoms that an electron could collide with than the orthorhombic face centred unit cell. This is why wire type very much effects resistance.
Temperature of the Wire
All atoms vibrate, even in a unit cell when they are tied down with bonds. If the temperature increases so does the rate of vibration. If the atoms are vibrating vigorously then the chances of a collision with an electron increase greatly as the atom is effectively taking up a larger area.
My Choice of Variable
For my coursework I have chosen to investigate the length of the wire. This is because the wire can be easily measured with a metre ruler or a tape measure. To investigate I would, ideally, need many different types of wire e.g. copper, aluminium, but as results from these cannot easily be displayed in a line graph a bar chart would be required. Also I wouldn’t be able to explain the results as I do not know enough about each of the different types of wires’ atomic structure. The width isn’t acceptable as the wire we have in school has a miniscule width and would be too awkward for me to measure accurately. Also it would be too difficult to measure the temperature of the wire as you need the whole wire to have the exact temperature and the necessary measuring equipment isn’t available to me at school.
Prediction
I predict that the longer the wire is, the more resistance there is. I predict this as the longer the wire is, the longer the crystal lattice is, and therefore the more atoms there are. This is shown in the diagram below.
As you can see above, as the length increases so does the number of atoms the electron can hit. Of course the wire above is only four unit cells long, and in real life should you increase the wire by a mere centimetre it could gain hundreds upon thousands of atoms. So if the number of atoms increases so does the number of collisions and therefore so does the resistance. I have drawn a graph to show what should happen as the length of a piece of wire is increased.
The above graph basically represents my entire prediction that, as the length of wire increases so does the number of atoms, which in turn increases the likelihood of a collision between the positive ions and the moving electrons. Should the length of wire double, so must the number of positive ions which in turn means the resistance should double. This means that the length of wire and the resistance are very closely related, and directly proportional to each other.
Variables
The independent variable is the length.
The dependant variable is the resistance.
The controlled variables shall be the type of wire, width of wire and the temperature of the wire.
The temperature of the wire will be constant as long as I keep the current the same throughout the experiment.
I have to keep the type and thickness of wire the same throughout the experiment as to prove my results are due to the length of wire increasing exclusively.
Method
Apparatus:
- 2 metre of Nichrome wire
- Voltmeter (0-5V)
- Ammeter (0-1A)
- Leads
- 2 Crocodile clips
- Heat proof mats
- Power Supply
- Variable Resistor
- Metre Ruler
The experiment will be set up in the manner below:
- I will measure 20cm of Nichrome wire and attach it in-between the crocodile clips.
- I will switch on the power supply, making sure it is supply 6V to the circuit.
- I read the ammeter and voltmeter and record the results.
- I shall switch off the power supply.
- I shall measure a 40cm length of wire and attach it in-between the crocodile clips.
- I shall switch on the power and change the resistance on the variable resistor until the ammeter reads the same as my first recording. I shall then record the voltage.
- I shall switch off the power.
- I shall measure a 60cm length of wire, and follow steps 5, 6 and 7 for that piece of wire.
- I shall then do the same for lengths of wire in intervals of 20cm until 2m.
- I shall replicate the experiment to create a second set of results.
Safety
I shall keep the power switched off as I change and measure, and replace a new length of wire.
I shall keep the wire separated from the bench via placing a heat proof mat underneath it.
I shall keep the current below 1A so as to prevent the wire becoming too warm.
I shall avoid touching the wire while the power is on.
Results Strategy
My results shall be displayed in a table such as the one below:
Calculations Used
Average Voltage/V= Voltage1+Voltage2
2
Resistance/Ω= Average Voltage
Current (A)
Graph
I shall go on to make an accurate graph showing my results on resistance against length.
I shall have a line of best fit through the graph.
I shall also use a real origin
The diagram below is how I believe my graph will turn out.
Obtaining Evidence
I calculated the average voltage by using the following calculation:
Average Voltage/V= Voltage1+Voltage2
2
e.g. Average Voltage/V= 0.6+0.6 = 0.6V
2
I calculated the resistance by using the following formula:
Resistance/Ω= Average Voltage
Current (A)
e.g. Resistance/Ω= 0.6 =2.0 Ω
0.3
The above results were recorded by following my plan, and I didn’t feel the need to alter my plan in any way.
Some of my voltages were slightly off, but not by much and I felt the average voltage would be accurate, so I didn’t repeat the experiment again for those voltages.
Interpreting
I have drawn a graph by hand and it is visible at the end of the Interpreting section. I have also however, created a computer drawn graph as I believe is may be more accurate in the plotting of the points
It is quite easy to see, on either graph, as the length increases so does the resistance. It is quite easy to see the strong trend and as you can see from my hand drawn graph as it passes through the origin, there cannot be any resistance without there being a length of wire.
I therefore conclude that the length of wire is directly proportional to the resistance which is what I predicted in my hypothesis. The prediction I made was “I predict that the longer the wire is the more resistance there is.” This is clearly correct as it is easy to see in either graph that there is definite positive correlation, i.e. as the length of wire increases the resistance increases.
To explain why resistance and wire length are directly proportional I shall go back to my scientific knowledge.
“As I have I already said; it takes many, many unit cells to make a small piece of Nichrome. Now if one electron had to pass through one simple cubic unit cell there would be four atoms to hit and it is possible the electron could hit all four. Now if an atom had to pass through millions of these then there could be many, many collisions. I have a rough graphs to represent this below.
The above graph shows that as the length of wire increases, so will the number of atoms/collisions; and if the number of collisions increases, as will the resistance.
The diagram above shows that the longer the wire, the longer, and more obstacle filled the path that the electron has to take is.
As I mentioned before the collisions an electron has with the atoms is the cause of resistance. So this should mean that as the length of wire increases so should the resistance.”
I now know that this does mean that as the length of wire increase the resistance does increase.
To summarise my reasons why resistance is directly proportional to the length of wire:
Nichrome wire consists of tiny structures called atoms. These atoms are the building blocks of everything. They are also the cause of resistance, as an electron collides with these on its way through the wire. These electrons are arranged with a repeating structure, which is known as a unit cell. These units cells join together to form a crystal lattice. As the length of wire increases, the crystal lattice increases which means the number of electrons has to increase. So therefore as the length of wire increases, the number of atoms for an electron to collide with increases in proportion to the increase in the length of wire. So length is directly proportional to the resistance of a wire.
Evaluating
As both my computer drawn graph and my hand drawn graph differ slightly from each other, my evaluating section shall be focused on my hand drawn graph solely.
There are two points I believe to be anomalous, and even then they aren’t that far off the trend line. They are the result for the 40cm length of wire, where there is too much resistance, and the result for the 120cm length of wire where there is too little resistance.
I shall firstly focus on the 40cm length. It is possible that I made a mistake in measuring the length of wire, which would explain it; if the length of wire was too big, the voltage would have been too great and therefore the resistance would have been too large. An error in the wire length could have been caused by a loop of wire which I didn’t straighten out which could have added as much as an extra centimetre of wire, which would have been more than enough to give me a false reading. It is also possible that since I was working on my own, when I tried to attach the crocodile clips the wire slipped and I gained some wire between the crocodile clips, as it was awkward to try and keep the wire the same length.
For the 120cm length, where there was too little resistance, so most likely there was too little wire between the crocodile clips. This could have been due to the fact I was working alone, and when I put the crocodile clips on I may have lost some length of the wire. Also, there could have been a mistake in the wire to begin with, as the wire keep slipping off the 0com mark, as there wasn’t enough wire at that end to hold down.
My graph does show enough evidence to come to the conclusion that resistance is directly proportional to the length of wire used as all the points on my graph follow the trend, although some are a tiny bit off. It is quite clear that there is a trend, and that resistance and length of wire are very closely related.
Measuring Instruments
Ammeter and Voltmeter
No, the meters weren’t zeroed at the start of the experiment, but I only really glanced at them, if I looked closely I may have found them to be a fraction off, which could have caused the discrepancy in my results.
The Metre Ruler
This was the best choice available to me at the time, but looking back it was quite a hassle to have to constantly measure my wire out again.
Other Apparatus
On the day, the wires seemed to be fine, but I know from previous experiments in school some of the wires have loose connections and actually cut out the circuit if put in the wrong position.
I think if I had to do my experiment again, I would have attached my wire temporarily to the metre stick, and I would have attached crocodile clips to the wire/metre stick at all the intervals I planned to record the resistance at. I believe this would have saved a lot of hassle, as well as errors, as the wire would be fully measured out, and all I would have to do is change which crocodile clip the wire was in.
Also, as I have 2 anomalous points I would have repeated the recordings for the lengths more times, possibly five times, which I believe would have given me very accurate recordings.
Finally, I believe that to reduce errors even further, if I were to repeat the experiment again I would use a multi meter which is far more accurate than an ammeter/ voltmeter.