From the preliminary experiments, I believe that the rate of reaction will change in each experiment. It should start off fast, and slow down over time, as the acid is used up.
The following preliminary work was done to assist my SC1 Investigation.
Fair Test
I shall make the main experiment a fair test by keeping the following variables the same, and therefore make sure my results are reliable and correct:
20g of marble chips shall be used each time the experiment is carried out.
The chips will be measured on a “Top-Pan Balance” to 2 decimal places.
The identity of the acid shall remain the same, i.e. Hydrochloric acid.
The starting temperature of the acid will stay the same – 20/21 degrees (room temperature) – by using a thermometer and a warm or cool water bath.
The total volume of liquid before or after dilution will always come to 40cm3.
The same apparatus shall be used, therefore, if there are any faults in the apparatus, all the results can still be compared.
Prediction
“I predict that the greater the concentration of acid, the quicker the reaction shall occur”
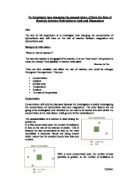
Prediction Explanation: I am able to justify my prediction by using a theory known as the “collision theory” which states that the more concentrated an acid is, the greater number of particle it contains. Therefore, there is a greater chance of the particles colliding.
The acid particles must collide with enough energy to make the reaction happen. In a less concentrated acid, e.g. 0.5M concentration, there are less acid particles and, therefore, there is less chance of collisions. The more collisions with enough energy cause the rate of reaction to increase.
Apparatus
Top-Pan Balance
Thermometer
Gas syringe fitted with a delivery tube and rubber bung
Retort stand and boss
100ml conical flask
50ml measuring cylinder
10ml graduated pipette
Pipette filler
Stopwatch
Watch glass
Weighing boat
Chemical Flask
20.00g. of large marble chips
Distilled Water
200 – 300 cm3 of 2M hydrochloric acid
The rate of the reaction was found by dividing the concentration of acid by the time taken for the gas syringe to fill up with a certain amount of Co2. An example of this is shown below, where 1M acid concentration and a 90cm3 volume of gas were used.
e.g. – 1/33 = 0.03 rate of reaction = 0.03
According to my results table and graphs, my data seems consistently reliable. However, on “Graph 1”, one of the 1.5M points does not come into contact with the best-fit line and is, therefore, an anomaly. This is because of a human timing error which meant the result was slightly inaccurate.
Graph Trends: An obvious trend can be seen on each graph. On graph 1 it can be seen that as the concentration of the acid increases, the time taken to collect a set volume of gas decreases. This is also shown on the second graph. The increasing steepness of the graph shows that, as the concentration of the acid increases, so does the rate of reaction.
Collision Theory: This states that the more concentrated an acid is, the greater number of particle it contains. Therefore, there is a greater chance of the particles colliding.
The acid particles must collide with enough energy to make the reaction happen. In a less concentrated acid, e.g. 0.5M concentration, there are less acid particles and, therefore, there is less chance of collisions. The more collisions with enough energy cause the rate of reaction to increase.
Because the table and graphs appear consistent, I am able to confidently make a conclusion based on them.
Evaluation
The apparatus used in this experiment were highly appropriate for the task. This is proved by the consistent results I gained. If there were any faults in the apparatus, it would have had an affect on all of the results and so would therefore still be comparable.
Despite an anomaly on Graph 1, the rest of the plotted points on the graphs were either on, or very near the best-fit line. This shows that my results were reliable and, therefore, I am able to make a conclusion to the experiment, based on the results and graphs, with confidence.
On “Graph 1”, one of the 1.5M points does not come into contact with the best-fit line and is, therefore, an anomaly. This is because of a human timing error which meant the result was slightly inaccurate.
An obvious trend can be seen on each graph. On graph 1 it can be seen that as the concentration of the acid increases, the time taken to collect a set volume of gas decreases. This is also shown on the second graph. The increasing steepness of the graph shows that, as the concentration of the acid increases, so does the rate of reaction.
If the best-fit line or curve did not go through the origin, it would have been due to human error e.g. error reading the gas syringe. However, all of my lines did go through the origin, which again show a good degree of accuracy. If such error had occurred in my results, I would have repeated the experiment five times to eradicate these errors and justify my results. Even though I have no anomalies, I shall still repeat the experiment to ensure my results are accurate.
To improve the experiment, I would swirl the marble chips in the Hydrochloric acid before inserting the bung.
Taking everything into account, I have enough evidence to justify making a conclusion.
Conclusion
From conducting this experiment I have discovered that as the concentration of an acid increases, the time taken to collect a set volume of gas decreases. Also, as the concentration of acid increases, the rate of reaction increases.
The experiment could be done again using a different acid e.g. Sulphuric acid, to show that all acids cause the same affect.