Series and parallel circuits. A single battery or generator often powers more than one electric device. In such cases, circuit designs called series circuits and parallel circuits are necessary. A series circuit has only one path. The same current flows through all parts of the path and all electric devices connected to it. Torches, some Christmas tree lights, and other simple devices use series circuits. In a parallel circuit, the current splits to flow through two or more paths. Parallel circuits enable a single energy source to provide current to more electric devices than a series circuit could.
Preliminary work.
Apparatus/ Equipments
1 meter plastic ruler-to measure length of wires
Nichrome Wires- to test
1 Ammeter-to record the amps
1 Volt meter-to record the voltage passing
1 variable DC power pack- the source of current
5 Wires- to connect the circuit together
2 Crocodile clips- to hold the wire in place
1 Wire cutter-to cut wires to suitable length
Cello tape-to keeps the wires in place
Micro-meter to measure diameter of wires.
Method:
LENGTH
- First collect the equipments listed above.
- Set up the circuit. Below is how it should be set up.
- Get a 1 meter ruler, and attach the chosen wire onto it.
- Secure it with cello-tape to ensure it stays straight and you have got the accurate length.
- Get a power pack and attach it to an ammeter with wires.
- Attach the ammeter to the wire using crocodile clips (you place the crocodile clips on the chosen length.)
- Attach another crocodile clip on the wire on 0cm. attach this wire to the power clip.
- You have now made a series circuit. But the voltmeter has to be added in parallel.
- Using another wire attach the voltmeter and the wire on the ruler together. Do the same to the other side.
- You have now made the circuit and are ready to start the experiment.
- put the wire connected to the ammeter on the wire at 100cm
- Switch on the plug for the variable dc power pack.
- Put it on 6 volts on the dial.
- One person should read out the values and the voltmeter and ammeter and the other should record it neatly on a table.
- Wait for the values on both meters to stop on one value. When the values are constant record it.
- Do this with the lengths 100cm, 90cm, 80cm, 70cm, 60cm, 50cm, 40cm, 30cm, 20cm and 10cm.
- When you have done all the values. Use the same wire and do the experiment again with the same type of wire. This will give you accurate results as you can then find an average.
- Any anomalous results can be repeated for accuracy.
WIDTH
- chose a wire
- Measure it on the micro-meter.
- Place the wire on the space in the micro-meter
- Using the small screw tighten it.
- Do not use the big one for thin wires as it can damage the micro-meter.
- The value it says on the micro-meter is the width of the wire.
- Set up the circuit above. (For more details on circuit look at (2.) in the length experiment method.)
- Chose a length which will stay the same all throughout the experiment. I chose 50cm as it was easy to remember, and because I didn’t think that it would burn with this length. Leave it on this length.
- Wait for the values on both meters to stop on one value. When the values are constant record it.
- do this with all the wires.-there are five
- When you have done all the wires. Repeat it to ensure accuracy.
- Any anomalous results can be repeated for accuracy.
Safety
It is vital that while I am doing this experiment I am safe, the environment around is safe as well as people around me so I have made a list of safety precautions that I will take.
- Be careful with the wire cutters. It should only be used to cut the wire to the desirable length.
- Before using the power pack it should be on 0 volts.
- Hands should be dry at all times, as we are working with electricity, as water is a very good conductor, and thus could be very dangerous.
- While handling live wires, it is essential to be careful.
- The voltage should be kept low because of safety factors and the wires heating up.
- Do not touch the wire when the power pack is turned on, because the current could heat up the wire very quickly in some cases.
- make sure the mains to the power supply is switched off when removing the wire from the circuit to be measured
- Do not switch on the power pack when there is no resistant wire and do not turn the power supply up too high because normal laboratory wires may melt.
A low voltage of 6V was chosen so that overheating was minimised, but the experiment remained its original speed. Furthermore, lengths lower than 10cm were not tried, which also helped to avoid overheating.
Fair testing
It is important that when I do the experiment, I make it a fair test in order for it to produce accurate and reliable results. So, in order for it to be a fair test I will make sure that I will do the following. I will;
- All apparatus must be checked to see if it is functioning properly and is giving a true reading. This will partly avoid systematic error.
- Use the same voltmeter, ammeter and power pack.
- When experimenting with diameter of wires de sure to use the same type of wire for e.g.: copper and constant are two different types of wires so be sure to use Constance.
- do the test twice with length an diameter to ensure accuracy
- Allow wire to cool between experiments, to ensure accurate results.
- Make sure that I keep all of the other variables the same.
- I will use the same wire every time and in I will use it again in my repeat experiment, so that the width and material of the wire will remain the same.
- I will also try to complete my experiment all on the same day, so that the temperature is the same through out all of my experiments. This is needed to be done, so I can compare the results and achieve good reliable average results.
Variables.
The resistance of a wire depends on certain factors. Some of these variables are listed below:
- Length of wire
- Diameter of wire
- Temperature of wire
- Material of wire
- Potential difference or voltage
- Humidity
- Cross-sectional area
- Voltage across circuit
All these factors will have to be kept constant except the diameter and length of the wire whilst doing the experiment to ensure that the investigation is a fair test.
I have decided to investigate how the diameter and length of a wire affects its resistance because other factors such as temperature are hard to control or vary. There is not a large enough range of materials to investigate how materials affect the resistance of a wire. The way in which the diameter of a wire affects the resistance is an efficient experiment to do. A graph can be plotted easily, there is a large range of results and the results can be recorded easily.
Length of wire:
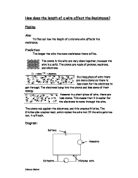
The length of a wire will affect the resistance because wires have a net of atoms and the electric current has to pass through this net. Every time an atom hits the net it loses some of its charge, therefore the longer the wire the larger the chance of the charged electrons colliding with the net and losing some of their charge therefore increasing the resistance.
Width of wire:
The width of a wire will affect the resistance because the wider a wire the more space in the net for the charged electrons to get through without colliding with the net and therefore decreasing the resistance. It is like letting a lot of water out of a small hole; it would go slowly, whereas with a bigger hole it flows out faster.
Temperature of wire
When the temperature of a metal increases the resistance of that metal increases. This is because when the temperature increases the atoms of the metal vibrate more vigoursly because of the increase in energy. This means that the electrons have more difficulty getting through the wire as they collide with the atoms which are in their pathway. This increases the amount of collisions therefore there is more resistance. However it is hard to keep the temperature exactly the same as the room temperature might change from day to day. It is essential to use a low voltage because it means a low current that will not heat up the wires. If a high voltage is used the energy would be in form of heat which would make the experiment unfair. The investigation will be done at room temperature. The temperature cannot be investigated because it is hard to control the range of temperature needed without the correct apparatus.
Type of material
Different materials have different resistances because the materials' atomic structures are different so some metals have low resistances and some have high resistances. Therefore it is important to keep the material the same throughout the experiment unless a different material is used to check if the conclusion or theory works for all materials. If different materials are used throughout the investigation, it will affect the results. For example if sometimes copper is used and sometimes nichrome is used, the results where copper is used will be of a low resistance because of the material and not because of the diameter or length of the wire. Throughout the experiment Constantan and nichrome will be used. Constantan is used to make sure my conclusion works for all materials. The type of material will affect the amount of free electrons that are able to flow through the wire. The number of free electrons depends on the amount of electrons in the outer shell of the atoms, so if there are more or larger atoms then there must be more electrons available. If the material has a high number of atoms there will be high number of electrons causing a lower resistance because of the increase of the number of electrons. If the particles in the material are tightly packed together, the electrons will have more collisions and therefore more resistance.
All these factors must be kept constant to make the investigation fair. The same apparatus must be used throughout the investigation. It is also important to take repeats to find an average and see any anomalous results.
Prediction
My hypothesis is that the thinner the wire, the higher the resistance. The thicker the wire, the lower the resistance.
This is because the thinner the wire is, the fewer paths there are for electrons in the wire therefore the harder it is for current to flow. This results in the energy not being able to spread out as much, so the resistance will be higher. This theory is similar to that of a door, where people represent the electrons and the door represents the diameter of the wire. If the door is wider, more people can get through, more easily. If the door is small, people have more difficulty and not as many people can walk in or out of the door. It is the same principal for electrons. If the diameter of a wire is thicker more electrons can go through the wire, therefore less resistance. The atoms from the metals cannot stop or collide with as many electrons because the diameter of the wire is larger.
I also predict that if the length increases then the resistance will also increase in proportion to the length. I think this because as I know from my scientific knowledge that:
Electric current is the movement of electrons through a conductor. In this experiment a metal wire (Nichrome will be the conductor). So when resistance is high, conductivity is low. Metals such as Nichrome conduct electricity well because the atoms in them do not hold on to their electrons very well. Free electrons are created, which carry a negative charge, to ¡¥jump¡¦ along the lines of atoms in a wire which are in a lattice structure. Resistance is when these electrons which flow towards the positive collide with other atoms; they transfer some of their kinetic energy. This transfer on collision is what causes resistance. So, if we double the length of a wire, the number of atoms in the wire doubles. This increases the number of collisions and energy transferred twice, so twice the amount of energy is required. This means the resistance is doubled.
Preliminary results.
Whilst doing preliminary work I will investigate the following:
· Get some sort of idea whether there is a connection between the length of the wire and the resistance within the circuit.
· Find out what kind of figures the resistance are for different lengths.
· Write the results of the preliminary work in a table below.
· Find the appropriate apparatus and use them.
· Investigate ways of making the experiment fairer and more reliable.
· see if the results obtained can be plotted in a line/scatter graph.
· The verification of techniques is important whilst doing preliminary work and to decide adjustments, which will have to be made whilst having precision and reliability in mind.
· Think about the appropriate length of the wire whilst doing the investigation. This can be found whilst doing preliminary work. The appropriate length will be one, which is easy to work with and has more precision.
6 volts
From my preliminary I found out that the longer the wire the more resistance there is. So far from the preliminary results show that my prediction is correct but I cannot be sure of this through one experiment therefore I will have to do many more tests to ensure I am correct.
From looking at this graph I can tell that this graph has positive correlation. Also using Microsoft Excel I calculated the correlation of the graph. The correlation of the line 0.985981. This tells me that the results are all very close to the line of bets fit; therefore the results are very close to accurate. From this I learnt that my method was reliable and I decided to use the same method but for the real experiment I would experiment 10 lengths.
My preliminary results told me that 6 volts was a good voltage to use as it did not burn the wire unlike 10v which did at 20cm. it also taught me that it was best to start the experiment of length from 100cm down to 10cm this way the wire will not burn at the beginning of the experiment if it does.
This also showed that the equipment I used where correct and did supply me with reliable results.
It also showed that I feel confident using the formula (volts/ amps) to find resistance
It also shows that the values are suitable for a line graph. This means that I can now use a line graph to show my results.
Lastly I also decided the length, which is better to use, is the 50cm wire because although the 100cm has higher resistances and therefore less percentage error, the 50cm wire is easier to handle, measure and cut. In other ways the 50cm wire is more accurate, for example during the preliminary experiment the wire, especially the thicker and longer wires could not placed straight on the ruler and so the length could not be measured properly. The longer the wires, the more bent the wires were and the more inaccurate the results would be. This is the reason for using pieces of metal wire, which are 50cm long, in the method.
In this experiment I went up in 20 gauge intervals and did realised that this does not give me enough results as the graph does not have as much detail. I decided that I will make it 10cm gauge intervals to make it more detailed and accurate.
Results
LENGHT
EXPERIMENT NO 1.
EXPERIMENT NO. 2
I then found the averages from both the experiments, but adding both the resistance and dividing it by two
Analysis
In my prediction, I stated that:
If the length increases than the resistance will also increase in direct proportion to the length.
From my graph, I can see that the resistance of the wire is directly proportional to the length of the wire. I know this because the Line of Best Fit is a straight line through the origin showing that if the length of the wire is increased then the resistance of the wire will also increase in proportion to each other. The line of best fit is a straight and it would go through (0, 0) if it continued, if there is no length, there is no resistance proving that the resistance of the wire is directly proportional to the length of the wire. This proves my prediction right. From looking at the graph I can tell that the graph has a positive corelaiton, and again, using excel I calculated the correlation of the graph. I found that the correlation of this graph was 0.985981, this shows that my results were extremely close to the line of best fit and also show that my experiment did give me correct results.
I can work out the gradient of this line by dividing the Resistance by the length.
y/x=gradient of line
7.45/50=0.149
The gradient of the line above is 0.15(2d.p)
The length of the wire affects the resistance of the wire because the number of atoms in the wire increases or decreases as the length of the wire increases or decreases in proportion.
The resistance of a wire depends on the number of collisions the electrons have with the atoms of the material, so if there is a larger number of atoms there will be a larger number of collisions that will increase the resistance of the wire. If a length of a wire contains a certain number of atoms when that length is increased, the number of atoms will also increase.
If the wire is half the length of a certain wire, it would have has half the number of atoms, this means that the electrons will collide with the atoms half the amount of times. In addition, if the length of the wire was trebled or quadrupled, then the resistance would also treble or quadruple. This in theory would mean that because at 100cm there would be a resistance of 14.65 Ohms at 20 cm it should be 2.93. From the graph it is easy to tell that the theory is correct and therefore my results reliable. From my results table and graph, I can see that my results that I collected are reliable and accurate. I know this because my results table do not shows any individual anomalous results. All the points are extremely close to the line indicating that my results are accurate.
I think that my results are suitable to confirm my prediction and support a conclusion. I know this because outside resources (Textbooks such as “physics for you”) say that 'the length increases in direct proportion to the resistance.´
WIDTH
EXPERIMENT NO 1.
EXPERIMENT NO 2.
Even though the names of the wires are the same the resistance is not because some of the wires have different diameters. For example one constantan 30 is 0.26mm and the other is 0.32mm.
The graph shows that the thicker the wire the lower the resistance. We can see this as the line goes down and there is a negative correlation. I know that the correlation of the graph is -0.78659, this tells me that there is a negative correlation an that the values are considerably close. The results therefore are reliable. The curve of best fit shows that there aren’t any anomalous results therefore I did not have to repeat the experiment.
My predication stated that
The thinner the wire, the higher the resistance. The thicker the wire, the lower the resistance.
My hypothesis was correct. This is because there are electrons in a circuit. These electrons travel around the circuit at an even pace. When they come to the wire I placed in the circuit the electrons have to slow down in order to be able to pass through it. This causes a resistance. The electrons will bump together and the more they bump the higher the resistance of the wire. In a thin wire these electrons have to squeeze tightly together in order to pass through, however in a thick wire these electrons do not have to squeeze together as much to be able to pass through. So the more they squeeze together, the higher the resistance.
As the thinner wire has the higher resistance it is said that resistance is inversely proportional to area.
Conclusion
Having performed the investigation, the following conclusions were drawn:
- As predicted, an increase in length resulted in an increased resistance. This can be clearly seen from the graph.
- The wire shows a strong trend of a straight line, i.e. the length of the wire is shown to be directly proportional to the resistance - double the length and the resistance doubles.
- I also found out that my hypothesis about the thinner the wire the higher the resistance was correct
- Ohms law was correct too.
- Lastly I found out that the thinner the wire the higher and resistance and the longer the wire the higher the resistance.
Evaluation
I think that my experiment went very well. I was able to collect enough accurate results to build up a very successful investigation. I was able to prove both my hypothesises correct using my scientific knowledge of resistance and the results I obtained form my investigation.
I think that my length experiment was very successful as I have not got any individual anomalous results. We can see this from the graph as all my results were in a straight line on the line of best fit.
While I was working I faced some minor problems but I soon found a solution to it and was able to solve it and carry on with the experiment. One of these problems was when the voltmeter did not stay on one number and the numbers weren’t similar. I decided to change this voltmeter and get a more reliable voltmeter, and in doing this I found that in fact I was correct and that the voltmeter was not working properly. So my new voltmeter gave me more reliable values to work with.
Another minor problem I faced was that when I first set up the experiment, there were lots of wires everywhere. It was really messy and this wasted my time as I had to learn to use the correct number of wires which were 5 wires. I then decide to draw out the circuit as this will help me to build the circuit quickly and efficiently. I found that it did help.
One of the other problems I had while doing this experiment was that I found it very difficult to make the thick wires completely straight as they were originally wrapped around a cylindrical tube. Therefore the length of the wire was not completely accurate when doing the tests. This could have affected both the tests for length and width to a certain extent. The thin wires where easy to control.
The second problem I faced was that I had to carry out my experiment over 2 lessons which meant I might have been working in different temperatures. This could have affected my results as temperature can affect resistance. (I have written about this in my theory). I think that I could have overcome this problem by carrying out all the experiment on the same day, and working even more efficiently.
Other than that I worked very well and did not face any more problems.
I worked safely and I believe this resulted in me receiving accurate results in the investigation to my accurate results.
I could have made a few improvements to my experiment to make it more accurate. Below I have made a list of the possible improvements I would make if I did this experiment again.
The modification I would make is
- To use pointers instead of crocodile clips to attach to the wire; I would do this because pointers would be more accurate. The pointers would be more accurate because the tips have a much smaller area than the crocodile clips giving a more accurate measurement of the length of wire.
- To keep the room temperature constant by using a fan heater.
- Make my wire as straight as possible by not using the wires on the cylindrical tubes.
- Carry out experiment with a gauge interval of 5 or 2 for a very detailed investigation.
- Do the experiments 3 times rather than two, this way any anomalous results can be seen quicker and solved.
Overall, I think the whole investigation went very well. It was successful and gave me the results I needed. It showed me that my predictions were CORRECT.
National Grid
The National Grid is an electricity transmission network of over 5,800km of lines and cables throughout the country. It operates at very high voltages (up to 400,000 volts).
How Does It Work?
At power stations, electricity is transformed to the higher voltage levels of 110,000, 220,000, or 400,000 Volts. It is then fed into a transmission network of 5,800km of overhead lines and underground cables carrying the electricity throughout the country. This network incorporates over one hundred high voltage transformer stations where the voltage is reduced to distribution voltages of 38,000, 20,000 and 10,000 volts. Some larger industrial premises are connected directly at these voltages.
Electricity is distributed at these 'medium' level voltages over an extensive distribution network of 80,000km of overhead lines and underground cables to smaller local substations close to customers' premises. At the local substations, it is finally transformed down to the normal mains voltage level for use by customers.
What are the benefits of a National Grid ?
Power stations do not have to be located in or close to populated areas.
When many power stations are feeding into a grid, the most efficient (and cheapest) stations can be chosen to produce electricity first and only the more expensive plant used when necessary. This lowers overall costs.
Connection to my investigation
The reason that I believe that the national grid is relevant to my investigation is because I know through my own research and from this investigation that thick wires minimize losses of 'low-grade' heat energy. Therefore the wires used in the National Grid system carry very high voltages
And fairly high currents over long distances, so they must be thick in order to minimize losses of 'low-grade' heat energy. As a result, cheap, low-density aluminium is used rather than expensive, high-density copper (although this metal has a lower resistance and so lower losses in conducting electrical energy).