-
Temperature – When a voltage is put through a piece of wire, it is heated up. If the wire is heated up the atoms in the wire will start to vibrate because of their increase in energy. This causes more collisions between the electrons and the atoms as the atoms are moving into the path of the electrons. This increase in collisions means that there will be an increase in resistance. This temperature aspect of our experiment will affect our results considerably. Also, this heating up is a loss of energy because as the electrons collide with atoms of the conductor, much kinetic (movement) energy is lots. This energy is transferred into heat to atoms, resulting in more collisions, so they lose drift velocity and resistance is increased.
- As said above, the resistance increases with temperature, and the temperature increases with voltage. We cannot help but put voltage through the circuit because we must record our current and voltage to discover the resistance. In our preliminary work, we investigated which voltages gave us consistent results and kept the temperature to a minimum, and 5V was the most sufficient at meeting these requirements. This work ahs therefore affected our plan greatly.
-
Material - The type of material will affect the amount of free electrons which are able to flow through the wire. The number of electrons depends on the amount of electrons in the outer shell of the atoms, so if there are more or larger atoms then there must be more electrons available. If the material has a high number of atoms there will be high number of electrons causing a lower resistance because of the increase in the number of electrons. Also if the atoms in the material are closely packed then the electrons will have more frequent collisions and the resistance will increase.
Therefore, in our experiment, we had many factors which affected the resistance of the copper wire.
Our variables were length and resistance. The other variables (temperature and material) will have to be kept constant in order to make sure that only length and resistance are investigated. In the experiment, the temperature, material and voltage needed to be kept at a constant rate to make certain that only the variables resistance and length are investigated. This is to ensure a fair test.
In order to keep a control over the temperature of the wire we took these precautions:
- Keeping the voltage at a fixed 5V. This is because in our preliminary work, we found this voltage gave us sufficiently consistent results
- Not insulating the wire in any way. Such as taping the wire to the ruler to measure accurate lengths. This insulation would only heat the wire even more (explained above)
- We kept the wire in open surroundings. This allowed air to circulate, keeping it relatively cool. This was quite ineffective though.
- We let the wire rest and cool between experiments for a minute or two.
Prediction
I predicted that if the length increases then the resistance will also increase in proportion to the length. I thought this because the longer the wire the more atoms and so the more likely the electrons are going to collide with the atoms. Therefore if the length is doubled the resistance should also double. This is because if the length is doubled the numbers of atoms will also double resulting in twice the number of collisions slowing the electrons down and increasing the resistance. My final graph should show that the
length is proportional to the resistance. The diagrams below are illustrating my prediction and should explain it more clearly:
Because the length of wire 1 is only half the length of wire 2, there should be half the number of collisions between the electrons and the atoms. Wire 1 is twice the length of the wire 2 and so there should be twice the number of atoms resulting in twice as many collisions and a predicted doubling of the resistance.
Accuracy
We took these precautions when attempting to measure results accurately:
- We handled the power supply carefully.
- We used a voltage of 5 volts only.
- We were careful when handling live wires.
- We controlled the temperature to our highest ability.
- We lined our wire up to a ruler to ensure accurate lengths.
Analysis
Results
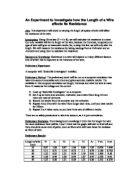
Above, I have shown our results recorded in an eight-column results table and have round off to relevant numbers of significant figures. I have taken the resistance measurements for both of my sets of results. This is in order to identify and track down any anomalies that may have occurred. The average of the two then gives an accurate number to then plot in a scatter graph. I have plotted this graph below, and added a line of best fit (trend line) by hand. I have extended this line backward 1 unit in order to discover the predicted resistance for 0cm of copper wire. I have plotted a graph showing resistance against length. This is in order to identify the direct proportionality between the two.
This graph above shows that my results have a clear positive correlation. This means that an obvious proportion is acting between the two sets of results. I have worked out the equation for the graph, which is shown as ‘y = 0.0157x’. This means that I can accurately work out the resistance for 20cm of wire, 20m or wire, or ‘n’ cm of wire. I just multiply whichever length I choose to calculate, and use the equation (y = 0.0157x). My predictions for the graph were partially correct. Here is my original prediction:
Prediction
I predicted that if the length increases then the resistance will also increase in proportion to the length. I thought this because the longer the wire the more atoms and so the more likely the electrons are going to collide with the atoms. So if the length is doubled the resistance should also double. This is because if the length is doubled the numbers of atoms will also double resulting in twice the number of collisions slowing the electrons down and increasing the resistance. My final graph should show that the
length is proportional to the resistance. The diagrams below are illustrating my prediction and should explain it more clearly:
Because the length of wire 1 is only half the length of wire 2, there should be half the number of collisions between the electrons and the atoms. Wire 1 is twice the length of the wire 2 and so there should be twice the number of atoms resulting in twice as many collisions and a predicted doubling of the resistance.
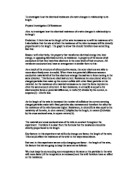
Graph 1 Graph 2
Problems
Graph 1 above is the prediction I made of the view of my graph of results. Graph two shows a diagram of the actual graph of results, and shows that even with zero cm of wire, there is still a resistance. This is because of the crocodile clips and connecting wires. Because we were using such small lengths of wire, which were applying such small values of resistance, this resistance can be affected by even the smallest change. The voltmeter was not placed in parallel over the copper only, but also over the crocodile clips connecting the wire into the circuit, and the connecting wires to the voltmeter (volts). The crocodile clips and connecting wires have affected our results because we are using such small lengths of wire. We are achieving such minute values of resistance that the crocodile clips and connecting wires affect are negligible. I talked to another group, who were using value of 20cm, 40 cm, 60cm etc. and the crocodile clips and connecting wires affect was not negligible because they had relatively high values of resistance. This means that we were recording the resistance of the crocodile clips and connecting wires, as well as the copper wire itself, which would affect our results. Therefore the crocodile clips and connecting wires alone were delivering a resistance of approximately 0.11Ω (see graph). I know this because if we were measuring simply the resistance of the piece of wire, then 0cm of wire, would give 0Ω of resistance. So that means we must take off 0.11Ω in order to make a resistance of 0Ω. If we were going to measure only the resistance of the copper wire, then we would need to remove the clips and connecting wires (because they are delivering the unwanted resistance) to do this, there fore we must subtract their resistances from the graph (0.11Ω)
We could obviously not predict that the crocodile clips and connecting wires would affect the resistance value in our experiments. So my prediction of ‘as the length increases then the resistance will also increase in proportion to the length’ was correct. This is seen on that graph by the close correlation between each result. We have a clear proportion between length and resistance shown on our graph. It is because of this that I have included the equation of the line and also a trend line.
So the graph below shows the same results, except I have subtracted the resistance of the crocodile clips and connecting wires (0.11).
So this proves the point that the crocodile clips and connecting wires really affect the results. This graph shows a nearly ideal set of results.
Evaluation
I felt our experiment went fairly well and to plan. However, as I pointed out in my analysis and plan, there were a few problems within the experiment, some of which we tried to control:
-
Temperature – As I stated in my plan, when a piece of wire has a voltage, it is heated up. If the wire is heated up the atoms in the wire will start to vibrate because of their increase in energy. This causes more collisions between the electrons and the atoms as the atoms are moving into the path of the electrons. This increase in collisions means that there will be an increase in resistance. Also, this heating up is a loss of energy because as the electrons collide with atoms of the conductor, much kinetic (movement) energy is lots. This energy is transferred into heat to atoms, resulting in more collisions, so they lose drift velocity and resistance is increased. In our experiment we had no choice but to give our circuit a voltage, in order to measure voltage and current. Keeping constant the temperature was difficult, but we did attempt to control this by:
- Keeping the voltage at a fixed 5V.
- Not insulating the wire in any way.
- Keeping the wire in open surroundings; this is to allow air to flow around keeping it relatively cool.
- Keeping the power pack active for as small amount of time in order to create less heat, and increase the resistance
Unfortunately, we still found the wire getting hot. So if I were to repeat this experiment I would:
- Use a thicker wire, allowing the cross-sectional area to increase, so creating a larger number of electrons per unit. This creates more gaps between the atoms for the electrons to flow, resulting in a lower resistance. This lower resistance will reduce the temperature therefore giving accurate, reliable and consistent results.
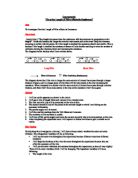
- Use larger lengths of wire. Ie. Use 10cm, 20cm, 30cm etc. I would do this because, as I said in the analysis, I talked to another group, who were using larger values of wire lengths. There results showed, when displayed on a graph with a trend line added, something relative to the diagram below:
This was because they were using such high values of wire lengths, and recording high values of resistance, that the small resistance of the crocodile clips was not negligible, and not visibly affecting the graphed results.
- I would also use two, or even three sets of wire. This would mean that we would use one wire, and it would suffer a slight increase in temperature. We would then leave that wire to cool, while using the other wire to experiment with and so on. This may cause a slight problem as there may be microscopic differentiations between the minute diameters of the wire, which would certainly affect our results.
- We would have wanted to have taken three readings for each length, this would have given us accurate and reliable, and mean we could remove any anomalies. Also our averages would have been more accurate and would increase the reliability of our results. The reason we couldn’t task three readings was because we did not have the time, because we were waiting to allow for the cooling of the wire. The above improvement to my plan (‘c)’) would mean that I would not have to allow for cooling, therefore saving time and allowing us to record a third or fourth (the more the better!) reading for each length.
Because of this temperature difficulty, this suggests a reason for our results to be unreliable and insufficient. But overall, when working with electricity, temperature is impossible to control and maintain
Anomalies
Below I have shown the graph for my results, and identified any possible anomalies in red.
Looking at this result, it doesn’t seem dramatically anomalous on the graph. This is why I have not removed it from our results altogether. I have also added the y-value of these results (resistance [Ω] value), and that this results resistance does not increase at all from these results subsequent to itself, in fact it remains constant. This must obviously be an anomaly because it is not scientifically, or physically possible for a wire, when kept at a relatively constant temperature, to remain constant in its resistance value, yet increase in length.
This is because;
- Thinking in terms of electrons in the conductor, the resistance must increase with length due to greater number of collisions with the atoms of the conductive metal that the electrons undergo. These collisions slow the drift movement of the electrons resulting in a lower current for a fixed voltage, resulting in an increased resistance. So if we have no increased resistance with greater length of wire, then there must be a problem. I believe that this is possibly because when we recorded the current and voltage for a 2cm length of wire, this wire had a high temperature. This gave us a lower current and so a higher resistance. As the wire cooled over time, we then recorded our value for a 3cm length of wire, and, because it had called gave us an accurate resistance value of the wire.
- Also, there could be another story behind this anomaly. If, for instance, we hadn’t quite measured 2cm accurately, this is difficult with such a small value. Even if the measurement was 1mm over 2cm, we would have gotten a higher resistance, and would produce an explanation for this anomaly. This is explained above.
This again questions the fact of whether my results are reliable. If every length was merely within 1mm of its required length, then all results are unreliable, and I believe that this was the main cause got the not so perfect correlation in my results graph.
Preliminary Work
Our preliminary work proved helpful in our experiment, but I would have like to have tried different materials in my preliminary work. I would also have liked to try out different voltages, but unfortunately we did not have the time. But our preliminary work helped us to decide which value lengths of wire to use, and which not to use.
Further Work
This experiment was helpful, and gave us relevant, valuable results and conclusions. But during my experiment, I have noticed several modifications I could make to improve on the Investigation if I was to repeat it:
- The first of these modifications would be the circuit that I would use. To be more accurate with my results I would place the metre rule directly under the wire, so therefore it would be measured easier and therefore making the lengths more precise.
- Instead of connecting the voltmeter to the main circuit, I would connect it to the wire that is being tested. I would do this so that the voltmeter is measuring the voltage of just the wire being tested and not the wires of the main circuit as well. So I would use the circuit illustrated below in a diagram. Using this circuit the voltmeter would be attached to the wire via crocodile clips. This again would pose the problem of the crocodile clips resistance. This problem is partially solved in the next moderation.
- I would also use normal pointers instead of crocodile clips to attach to the wire; I would do this, a) because pointers would be more accurate because the tips have a much smaller area than the crocodile clips giving a more accurate measurement of the length of wire, b) I predict that the pointer would deliver less resistance than the clips, and so improve the reliability of my results.
- I didn’t control the room temperature but instead just assumed it was kept constant throughout my experiment; this could have made the wire get hotter and therefore making my experiment not as accurate. Even though it would only make a minute difference, I would control this variable factor and make it a constant factor if I were to repeat the test. I would do this, because it would be an unfair test if there were two known variables.
As well as making these alterations to my test, I could also expand on my investigation by testing the same wire but different widths of that wire. I would have done this if I had more time to complete it. I think the circuit and method used was okay, although I would make the modifications above to improve the reliability of my results. If I did this experiment again I would use high quality equipment and would probably control the temperature and use pointers instead of crocodile clips. After changing those few things, there is not really much difference to how I would do the experiment again.
Ends