Resistance, measured in Ohms, is something which slows down current flow in a given material/component – in this case, nichrome wire. Ohms Law is a formula discovered by George Ohm which helps determine resistance. It is usually used to calculate the missing value in a given circuit.
When V is the voltage (V), I is the current (A), R is the resistance (Ohms). Ohm’s Law describes that the current flowing (I) through a metal wire is proportional to the potential difference (V) across it. Therefore, Ohm’s Law can be written down like this:
I will use the following formulas during my experiment:
I can also use the formula triangle below to work out the resistance of a material.
In this way, George Ohm and his theories will prove a very useful formula during my experiment, and when calculating my results.
Safety
Although this is a fairly simple experiment, correct safety precautions should be made in order to perform the experiment correctly.
During the experiment:
- Do not increase the voltage running through the wire higher than 4 volts, as the wire will get extremely hot.
- Do not use lengths of nichrome wire any smaller than 20cm, or it will heat up too quickly and be quite dangerous.
- Also, changing the lengths of the nichrome wire should only be carried out when all power is switched off – to avoid burns and other injuries.
- Make sure all apparatus is set up properly and correctly connected.
- After each experiment, make sure all power is switched off and the wires have cooled down before handling apparatus.
- Never touch the nichrome wire whilst the power is on.
- Make sure your work surface is dry, and clear of obstructions.
- Be careful when using wire cutters to cut wire, as they are sharp and cause injury.
Equipment List
To carry out the experiment correctly, the following apparatus will be needed.
-
1 Pair of wire cutters – to cut the nichrome wire with.
-
1 Power pack – To provide voltage needed, and to control how many volts used.
-
1 Voltmeter – to measure the voltage .
-
1 Ammeter – to measure the current.
-
1 Meter of nichrome wire – to provide resistance.
-
4 Connecting wires - to connect circuit together.
-
2 Crocodile clips – to hold nichrome wire in place.
-
1 Meter ruler – to accurately measure the nichrome wire to chosen lengths.
-
1 Calculator – to work out averages and resistance.
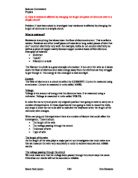
Set-Up Diagram
The experiment should be set up in the following way, shown on the following page.
Preliminary Work
Prior to my real experiment, I conducted a preliminary experiment in class, in order to try out my method and see if my prediction was somewhat accurate. Also, doing a preliminary experiment lets me check whether any adaptations or changes to be made.
Method Plan
- Using the set-up diagram above, set up the parallel circuit using the apparatus provided.
- Using the meter ruler, measure out 20cm of nichrome wire, and place the crocodile clips on it to hold it in place.
- Switch on the power pack to 4 volts.
- Read the recordings on both the voltmeter and ammeter, and write them down in a table.
- Turn the power pack off, and repeat the test two more times.
- Repeat steps 2 – 6 again, using 40cm and then 60cm of nichrome wire.
- After the experiment, work out the averages and put the results in a table.
Preliminary Results Table
The graph above somewhat proves the my prediction was correct – as the length of the wire increases, so does it’s resistance.
Preliminary Changes
From my preliminary experiment and my results, I can draw the conclusion that although the results are fairly accurate, the following modification need to be made:
- A larger range of lengths of wire should be used. In my experiment, I will use 20cm, 40cm, 60cm, 80cm and 100cm of nichrome wire.
- Lengths of wire shorter than 20cm should not be used, as they heat up too quickly, not giving enough time to record results and making them less accurate.
I have decided to keep the rest of the method the same in my experiment.
Method
- Using the set-up diagram above, set up the parallel circuit using the apparatus provided.
- Using the meter ruler, measure out 20cm of nichrome wire, and place the crocodile clips on it to hold it in place.
- Switch on the power pack to 4 volts.
- Read the recordings on both the voltmeter and ammeter, and write them down in a table.
- Turn the power pack off, and repeat the test two more times.
- Repeat steps 2 – 6 again, using 40cm, 60cm, 80cm and 100cm of nichrome wire.
- After the experiment, work out the averages and put the results in a table and graph.
Results Table
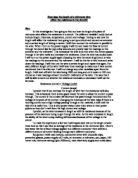
Analysis
In order to make a line graph of results, I calculated the averages of each test and recorded the average resistance. I used these results to make the graph above. My best-fit line (shown in black) shows that there were two slightly anomalous results (at lengths of wire 80cm and 100cm).
My graph shows that between the lengths of wire 20cm to 60cm, the resistance increases fairly equally. But, the anomalous results between 80cm to 100cm shows that these results are different – or perhaps the experiments for these two lengths were just not conducted correctly.
My graph and best fit line shows that the results that I have obtained support my original prediction. This is because in the prediction, I stated that “I predict that as I increase the length of the wire, the resistance will increase.” The results have shown that this is true.
The results from the graph on the previous page show the relationship between the resistance of a wire and its length. As the length of the wire increases, so does its resistance. From this, I can draw the conclusion that there is a strong positive relationship between the length of the wire its resistance. Using the best fit line, I can also conclude that the results are almost directly proportional, meaning that when one doubles, so does the other.
The theory behind this idea is explained in detail in my hypothesis. In a metal wire, electric current will only flow if there are charges which can move freely. Metals contain a “sea” of electrons (which are negatively charged) and which flow throughout the metal. This is what allows electric current to flow so well in metals. Resistance is when the free electrons moving through the wire collide with atoms, their path through the wire is more difficult. This means that if there are more atoms in the way to collide with the free electrons, the resistance is increased. In a length of wire, there will be a number of atoms. In a length twice it’s size, there will be twice the number of atoms. In this way, there will be double the collisions between the electrons and the atoms in the wire, increasing the resistance by two. This explains why the results are almost directly proportional.
My best fit line clearly shows that most of my results have followed this trend. All my results are very close to the line, except for the two results which are anomalous (circled in red on the graph). From both my graph and results table, I can estimate that the results I obtained are relatively accurate and precise. Apart from the anomalous results at 80cm and 100cm, all the other points are extremely close to the best fit line, indicating that my results are relatively accurate.
I think that experiment I carried out was reasonably successful. My results were consistent, and they made an accurate comparison to that in my prediction. I followed my method plan correctly, and I believe that I obtained accurate enough results to conclude that my results match my original prediction – “I predict that as I increase the length of the wire, the resistance will increase.”
Evaluation
In my opinion, my experiment went quite well. I obtained a decent set of results, that correspond with my prediction and so am in turn pleased with my investigation.
Despite all this, there were two anomalous results. For this reason, I believe that certain factors during my experiment could have affected my results and therefore added to these anomalies.
Although 3 repetitions of each length of wire were satisfactory, the two anomalous results at 80cm and 100cm would need to be repeated, in order to make sure the results were accurate, and if not, to correct them.
As the anomalous results were at 80cm and 100cm, I believe that their high length caused this. The longer wire was harder to stretch out and difficult to measure accurately. This could have influenced my results.
As I increased the length of the wire, the wire became hotter and gave off increasing amounts of heat. This might explain the anomalous results on my graph, as I may have not allowed enough time for the wire to cool down entirely before trying the next part of the experiment. Because the wire was hotter, it caused the atoms in it to vibrate more, making it harder for the electrons to travel through it – so the resistance was already higher than normal – and so it was not entirely a fair test.
Another possible factor that might have added to my anomalous results was the reliability of the ammeter and voltmeter I used during my experiment. At times, the data on their screens kept changing. After doing my best to find the correct reading on each one, I may have made some mistakes, and so ended up with the wrong average resistance.
These anomalies could have been somewhat avoided if the following changes were made:
- Be more accurate in my measuring of the wire – placing the meter rule flat on the work surface, and making sure measurements were exactly correct.
- Keeping the wire taught at all times during measuring – if it is not, the looseness will affect its length, and results would not be accurate.
- Positioning the crocodile clips more accurately, as their place on the wire will also affect its resistance.
- Letting the wire cool down for a sufficient amount of time in between the readings.
- Using more accurate voltmeters and ammeters – this would have increased the accuracy of each reading, and therefore would improve the accuracy of the average resistances.
Regardless of the anomalies in my experiment, the rest of my experiment is quite reliable. I think the reason for this was that I took great care in carrying out most aspects of the experiment.
Other experiments that I could carry out involving similar apparatus could be:
- Using different types of metal wire, for example, copper wire instead of nichrome wire. These might affect the resistance, and it would be interesting to see if the same trends occur.
- Using different thicknesses of wire. This might affect the resistance also, as the wire’s total area (and therefore it’s space for electron movement) would have changed.