When the temperature raises the rate of photosynthesis rises also. This is because the particles in the reaction move quicker and collide more. There is an optimum temperature however .At this point the of photosynthesis progresses as fast as it can limited only by the other factors beyond this temperature the enzymes controlling the become denatured and the reaction quickly comes to a halt.
Effect of light Temperature
Photosynthesis needs light because in the plant do not photosynthesise in the dark and, they only photosynthesise slowly in dim light.
We can give plants growing in green houses more light. This is not needed in some but it is often done ion winter for valuable crops.
When we do this we find that we can only increase the rate of photosynthesis up to a certain level. After that, increasing the amount of light does not increase the rate of photosynthesis any further. Some other factors such as shortage of carbon dioxide or low temperatures is now limiting the rate of photosynthesis.
Temperature as a limiting factor
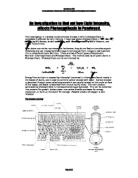
Temperature speeds up the rate of photosynthesis in two ways:
1. It speeds up the molecules that react inside the chloroplasts;
2. It speeds up the rate at which carbon dioxide from the atmosphere gets into the leaves.
We cannot increase the temperature for crops growing in fields but we can for plants growing in a greenhouse. This is not needed in summer but it is often done in winter for valuable crops. The heat is usually supplied by burning propane.
When we do this we find that we can only increase the rate of photosynthesis up to a certain level. After that that, increasing the temperature does not increase the rate of photosynthesis any further. Some other factor such as shortage of carbon dioxide or low light level is
Prediction
1) I predict is that the closer the lamp to the pondweed the more bubbles there will be and the further away the lamp is from the pondweed the bubbles will increase.
2) I predict is that the rate of photosynthesis will increase when the lamp is closer and the rate of photosynthesis will decrease when the lamp is far away.
3) I predicted that at 10cm, I will count more bubbles than when it is at 30cm where I will count less bubbles. My predictions are based on previous year 10 elodea photosynthesis results.
Fair Test
To make this investigation fair I will make sure that I use the same pondweed. I will use same lamp. I will use the same number of watts. I will use the same amount of water and that I will use the same apparatus. If I do not keep these the same then investigation will not be fair and will not give me the right results.
Safety:
The safety I will use is I will wear gloves to protect my eyes, gloves to keep my hands clean and I will do my experiment standing up to secure my safety of dropping a chair.
Independent Variables
The independent variables are the things that I will be keeping the same this is the distance the light will be increasing and decreasing the distance from the light source to the plant
Dependent Variable
The dependent variable are the things that I will be changing there’s will be the amount of gas proceed which I will then measured by counting the bubbles.
Method
We placed some pondweed under a filtering funnel and on top of the funnel we placed a test tube so the oxygen cannot get out. We then filled it up with water to the top and counted the number of bubbles, which where being produced by the plant to show us that it was photosynthesing. We then placed a the lamp next to the pondweed which was producing the light for the plant to photosynthesise and kept moving it away from the pondweed to see how much oxygen is being giving out every minute. We did this three times so it could give us the right results.
Obtaining Evidence
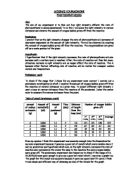
The preliminary I will use is 5, 10 and15, for this I will count the numbers of bubbles. I am doing this so I can get a more reliable result.
My preliminary results
My experiment results
Apparatus list
Pondweed
Lamp
Test tube
Cold water
Stopwatch
Analysis
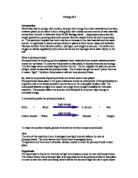
My graph was in the form of a best-fit curve. I drew it as a curve rather than a straight line because of the clear pattern of the points. This meant that the rate of photosynthesis decreased as the light moved further away from the pondweed. This is because photosynthesis is a reaction, which needs energy from light to work, so as the amount of energy available from light increased with the rise in light intensity, so did the amount of oxygen produced as a product of photosynthesis. My graph shows that relationship between the light and the rate of the photosynthesis was a non-linear, as all the graphs produced had a curve. However as I expected in my hypothesis, it does not appear that the curve part on the graphs, the increase in rate is in fact proportional to the light.
Evaluation and conclusion
Overall my experiment went really well. There was nothing in this experiment, which I could not do. I kept it a fair test as I did not make any changes while I was doing it. I kept everything the same apart from doing the experiment on two different days I think if I had done It all in one day I would have got better result as where was a change over weather over the two days which I done the experiment this may be why I got some anomalous result.