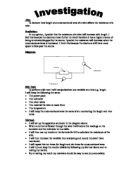
We cut our pieces of wire to 10cm, measured their diameter with a micrometer, then worked out the cross sectional area, using the formula IIr² = area we then tested 3 different wires, each with a different cross sectional area. While experimenting with this, we found that the wire got very hot quite quickly. This was a major problem, as if the temperature of the wire increased, so would the resistance, because a higher temperature causes the wire’s atoms to vibrate more, making it harder for the electrons to flow through the wire. This would cause our results to turn out inaccurate, and our experiment would not be a fair test.
To solve this problem, we will increase the length of the wire to 1.0m, but to ensure the experiment was completely fair we will add a switch into our circuit, to make sure the wire will stay cool. We will also use five wires, each with a different cross-sectional area, so we get a wider range of results, allowing us to plot a more accurate graph. We will take three readings on each different wire, and then find an average resistance using the formula:
Resistance = Current (I)
Voltage (V)
Fair Test- The variable we will be changing in our investigation is the cross-sectional area of the wire. To ensure it is a fair test, we will keep the length, material and the temperature of the wire constant throughout the entire experiment, because if any one of these were changed, it would affect the resistance of the wire. The length was kept at 1.0m, and the all the pieces of wire used were composed of nichrome. If the wire had heated up, the resistance would increase, due to the high rate at which the wire’s atoms were vibrating. This would make our experiment inaccurate, so we inserted a switch into our circuit, and took the readings quickly but carefully, to ensure no mistakes were made.
OBSERVING:
Results-
Key:
Anomalous result
ANALYSIS:
Conclusion- My results tell me that as the cross sectional area increases, the resistance decreases, but this only seems to agree with my theory, which stated the resistance would halve as the cross sectional area doubled, up to a cross sectional area of 0.075mm. After this point, the relationship between the resistance and the cross sectional area is no longer linear. This may be because there is a certain point where the resistance cannot increase anymore, and maximum amount of electrons are flowing through the wire. I will need to repeat this experiment again to discover more about this theory, and why the graph does not follow the same pattern the whole way through.
Evaluation- the results were very accurate; apart from one reading, which was anomalous, the line of best fit was very close/went through all of the points on the graph. We are not sure why the anomalous result turned out how it did, it may have been because the wires were touching, or the wire got too hot. We identified our anomaly, and solved our problem by repeating the test one more time, so the anomalous result did not affect our averages, and our analysis of results contained no anomalies.
I think our experiment could be improved by using a greater range of wires with different cross sectional areas, as it could help work confirm why my theory only worked to a certain point in this experiment. Another improvement could be to use another piece of equipment to ensure the wires do not cross over and to hold them in place; this would save a lot of time going over anomalous results and repeating tests more times than is needed. This time could then be used to ensure that each piece of wire is measured completely accurately, and doing equipment checks before each experiment to make sure all equipment is in good working order.
If I were to extend this investigation, I would look into how different voltages would affect this experiment, and how this would help with my theory. I could also change the variables that I am keeping constant, for example repeating my entire experiment with a wire with a temperature of 40 degrees centigrade, and then repeat it with a wire of 10 degrees centigrade.