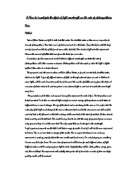
The wavelength in the spectrum changes as the colours change. It is said to be that that the shorter the wavelength the more energy is provided and also the longer the wavelength the less energy is provide. This is because the photons in the different colours hold more energy as the wavelength decreases in size. Some colours of visible light are not absorbed such as green. Green instead is reflected into our eyes that tell us that the plant is green. This is because the chlorophyll is green. But other colours such as purple, yellow and red closer tare absorbed but at different amounts.
I predict that the order of best absorption in a plat to produce more bubbles will be blue, yellow, orange, red and finally green. I predict this because blue has the shortest wavelength which produces the most energy and there is slightly higher absorption in the blue region by chlorophyll. The red has the largest wavelength in the visible spectrum which produces the least energy. It could also be the fact that the blue photons in the light spectrum have more energy in them than any other colour I am testing. The reason why green is at the bottom of the list of absorption in a plant is because green is reflected off the plant and not absorbed as much as the others. It is reflected of the plant to be seen as green in our eyes.
Diagram
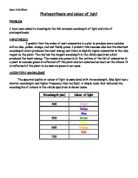
Method
At first a piece of pondweed is place into a beaker of 500 cm³ of water. Then a lamp will placed next to the beaker, the lamp will be shining into the beaker were the pondweed is. The distance between the lamp and the beaker is set to 2cm at all times. Then another beaker of 500 cm³ of water will be placed in between the lamp and the beaker. This beaker will not hold any pondweed in it. This is done to make sure that no heat energy is transferred into the pondweed and only light energy is transferred. The beaker with only light will trap the heat so that it does not go to the beaker with pondweed inside it. We will then add 2 grams of Sodium Hydrogen Carbonate to the beaker with pondweed in it. This will increase the amount of carbon dioxide in the plant to increase the amount of photosynthesis occurring in the plant. Then a micro burette will be placed in the water over the pondweed were oxygen is let off. The micro burette will be used to collect up the bubbles of oxygen which will be measured at the end of each test to analyse the release of oxygen in the plant. The micro burette will be placed for 1 minute each test and we will measure how much oxygen is released from the plant. This will be done three times. This is done to see if all the measurements were done fairly and accurate. Also this was done three times to find a good average so that a good graph can be drawn. Another reason why a graph is drawn is because it makes it easier to spot anomalous results.
After testing for white light there is other colour lights that can be tested such as orange, blue, green yellow and red. To test the other different colours of light the use of coloured filters would have to be used. The filters will be put in front of the lamp and made sure that no any other colour will be absorbed by the plant from the light, as this would affect the experiment and give the wrong results. The coloured light will then be directed to the pondweed using the same apparatus as used in the first experiment using the white light. This test will also be done three times to find a good average. This experiment will be done to see what affect different coloured light will have on a plant and the rate of photosynthesis by measuring the oxygen given by the plant.
Results Table
We used white as a control to see that if we were doing anything wrong with the experiment as it gives off the highest amount of oxygen than any other colour in the experiment.
Analysis
In the graph shown above, starting from blue at 440 nano metres and 0.17 in arbitrary units slowly decreases to 0.1 arbitrary units and the nano metre of 505 which is green. After a slow decrease the amount of oxygen released increased steeply to 550(nm) and 0.53 in arbitrary units at yellow. This was the highest oxygen released per minute in arbitrary units out of all colours I have tested. The graph then shows a rapid decrease down to 575 (nm) and 0.43 in arbitrary units at orange. It then decreased slowly down to red, which was at 630 (nm) and 0.37 arbitrary units.
The reason why blue was probably absorbed less instead of being one of the highest absorbed in a plant was probably because the testing for this colour was done wrong and also the fact that it was not done under good conditions. As there could have been other lights that may have entered, changing the results of the experiment.
The reason why the green light was the least absorbed out of all six colours (not including white) was because of the fact that the green light is actually reflected into our eyes. But even though it is reflected some of it still gets absorbed as it has one of the highest energy rates out of all the colours in the visible spectrum.
The rest of my results in the graph was quiet accurate. As the three colours follow my prediction well. The reason why yellow is the most absorbed by the plant is because of its high energy as photons that the chloroplast needs to split the water with to create oxygen and glucose.
The reason why orange is absorbed less by the chloroplast then yellow is because the orange colour has bigger wavelengths. Therefore the photons in this colour have less energy hence the yellow colour is favoured over the orange in a plant.
The same reason goes for the colour red, as less energy is held in the photons. This is why it is not absorbed much as any other colour as there are better colours to absorb from to give more food for the plant.
My results fit my prediction quite well. As the order of colours in the prediction fit the results and the graph quite well as well. Except for one colour, blue. This could have happened because of impractical mistakes made in practical.
Evaluation
In the table, the results show that I have consistent results. Although they are consistent I do not think they are accurate. In the prediction it says that blue would be the most absorbed as it has the most energy to produce more oxygen. But as seen in the graph and results table, it has one of the lowest bubble rate counts. Although green should not give of as much oxygen as the rest of the colours I think that it still shouldn’t give of no oxygen at all I think that this could be an anomalous result in my table. My results in my table did not follow my prediction as it is in the wrong way around. But the colour green was correct as it releases the least amount of oxygen.
The reason why this could have happened is because of the surrounding lights around the plant that could have changed the amount of oxygen released. I could have changed and improved the experiment by making sure that the only light going in was the colour that I chose. Another way of improving my results is by making sure that the oxygen collected is from in the leaf and not from outside the leaf as this might not be from the reaction to produce oxygen.
Although my results where inaccurate to my prediction I still think that they were good as they were consistent and there was only one anomalous result that still looked quite consistent. But I would not rely on these results because they are not correct. Such as the colours blue, yellow and orange.
I could do more experiments for this investigation, as there are two more parameters that can be varied to change the release of oxygen in the plant. The two other factors are amount of carbon dioxide added and water added. I could also vary the amount of sunlight on the plant to change the amount of oxygen released.
As a conclusion to this experiment I think my results were good enough to say that it fit my prediction and that with a little bit more precautions I could have proved my prediction completely correct.