This work
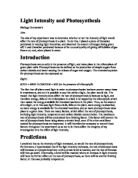
We can see how different wavelengths of light affect photosynthesis by looking at action spectra. An action spectrum relates the rate of photosynthesis to the wavelength of light being received by a plant. For green plants, including algae, the action spectrum shows that most photosynthetic activity takes place in blue-violet and orange-red lights since these are the colours which are mostly absorbed by the main chlorophylls and the carotenoids. Photosynthetic activity is lowest in green light since green light is hardly absorbed at all by these pigments. The relative absorption of light of different wavelengths by pigments can be shown in absorption spectra. Action and absorption spectra correspond quite closely. Wavelengths of light which are more readily absorbed by photosynthetic pigments cause higher levels of photosynthesis.
Some plants live in conditions where the spectral quality of light may be different to that received by plants living on the land. Algae which live in surface waters tend to be green and contain more or less the same pigments as land plants since they exist under similar light conditions. Algae living lower in the water receive more blue light than red because red light has a relatively long wavelength and cannot penetrate water as well as blue light which has a shorter wavelength and more energy than red light.
Brown algae, which may be found deeper in the water than green algae, have combinations of pigments which enable them to photosynthesise using less of the red light utilised by green plants. Red algae, which tend to be found at even greater depths, contain more pigments to absorb the blue light which penetrates deeper into the water.
It is the combination of pigments in a plant which determines which wavelengths of light can be utilised in photosynthesis. No plant absorbs light with equal effectiveness across the visible spectrum. This is why different colours of light may affect photosynthesis and the subsequent growth of plants.
EQUIPMENT
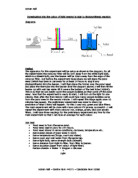
The equipment that I used was:
- Elodea
- Lamp
- Beaker
- Plasticine
- Syringe
- Ruler – measure the distance between the lamp and the plant
- Timer – measure time
- Sodium hydrogen carbonate
METHOD
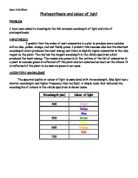
Firstly I collected the equipment and set it up. We then filled the beaker with 400ml of 2% sodium hydrogen carbonate. To this we added the elodea and placed the beaker 50 cm away from the lamp. We then placed a coloured filter and placed it in front of the lamp. We left the plant there for 2 minutes (acclimatise to the conditions), and then placed the syringe over the plant. We decided that we would measure the volume of gas evolved from the plant during a 5-minute period. We then repeated using the same colour to ensure that our results are accurate. Once that was completed we changed the colour of the filters, we will use the following colours: Violet, blue, green, orange, yellow and red.
SAFETY
We tried to keep the water well away from the electricity. We also tried to be careful when using the blade to cut the plant.
FAIRTEST
We tried to pop all the bubbles as soon as they formed. We also used the same plant and same quality of chemicals. We also kept the light the same distance from the plant throughout the experiment.
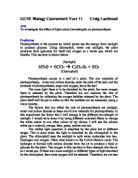
RESULTS
ANALYSING
From the results that I have gathered I can state that certain wavelengths affect the rate of photosynthesis more than others. My results were not exactly the same as the graph on page two, but several different things could cause this. Human error may have caused the results to be inaccurate. Some white light could have been used by the elodea, causing the rate of photosynthesis to go up slightly. The heat being produced from the light may have also affected the rate of photosynthesis. Since temperature affects the movement of molecules and the reactions worked by enzymes, the heated molecules and enzymes may be the cause of the increasing rate of photosynthesis, because photosynthesis works using enzymes.
My results fit my hypothesis quite well, as the order of colours in the hypothesis fit the results and the graph quite well, except for one colour, blue. This could have happened because of impractical mistakes made in practical.
EVALUATING
In the table, the results show that I have consistent results. Although they are consistent I do not think they are very accurate. In hypothesis I said that blue would be the most absorbed as it has the most energy to produce more oxygen. But as seen in the graph and results table, it only has the second highest bubble rate. Another strange result that I had was that green did not have the lowest bubble rate. I would have expected green to have the lowest bubble rate as the plant was also green, meaning that the green light should have been reflected back by the plant. However this could be because of a number of reasons, the shade of green that the filter was could have been a different shade to that of the plant.
I could do more experiments for this investigation, as there are two more things that can be varied to change the release of oxygen in the plant. The two other factors are the amount of carbon dioxide added and water added. I could also vary the intensity of light on the plant to change the amount of oxygen released. This coursework
As a conclusion to this experiment I think my results were good enough to say that they fitted my hypothesis and that with a little more precaution I could have proved my hypothesis completely correct.