Choosing a suitable range and testing methodology
Two metre rules were taped at a 90° angle to the wall. A ping-pong ball was then dropped from a range of heights, from 10cm to 120cm, with a 10cm difference between each height. The ball was dropped three times from each height and the results were recorded.
The range most suitable for this experiment would start from 20 cm. If the ball is bounced from lower e.g. 10cm, its bounce is so quick that reading off its bounce height will be hard to do, and therefore results will be less accurate. As many heights as time allows must be done, but at least 10 readings are needed to give suitable accuracy.
Method
Safety
Don’t throw the ball down as it can bounce out of control and hit someone. Drop the ball at arm’s length so that it doesn’t bounce back up into body or face.
Accuracy and control of variables
- Make sure that the ball has no splits, which will affect its bounce and therefore the accuracy of the measurements.
- Keep the surface that the ball is bouncing on the same. This is important because surfaces such as carpet absorb more of the ball’s elastic energy when the ball hits it. The carpet will also produce more friction when the ball hits it so more of the original energy will be converted into waste energy. Therefore if the surfaces change, the results will be altered, so for this experiment the classroom floor (vinyl) will be the surface used.
- Drop the ball, do not throw it. As the force for KE = ½mv², if the force is altered then the speed at which the ball travels will be altered and so the amount of energy produced will be different. Just dropping the ball will ensure that the same force is used each time, ensure a fait test and accurate measurements.
- Ensure that there is nothing that the ball can hit against that will distort the readings. Be very careful how you drop it, so that it doesn’t hit against the wall during its bounce, and change the measurements.
- Keep the temperature of the ball the same. If the ball is heated up, this means there will be more elastic energy when the ball bounces, and s it will travel further, and affect the speed at which the ball travels distorting the results.
- Use the same ball each time. The weight of the ball may vary from one to another so it is important to keep this variable constant. As the formula for KE = ½mv², if the mass is changed then the energy will change.
- Practice before doing the experiment. When first trying to read off the height that the ball has bounced to, it will prove difficult, but with practice this will become easier and so results will be more accurate.
- Throw with the same hand each time, to ensure that the same force is used.
- In both the preliminary and the actual experiments, check constantly to see that the ruler is at 90° to the surface. This will improve the accuracy of the measurements recorded.
- The only variable that will change is the height the ball is dropped from. The tennis ball will be dropped from heights of 20cm, 30cm, 40cm, 50cm, 60 cm, 70 cm, 80 cm, 90 cm, 100 cm and 110 cm. Each height will be repeated 3 times and an average will be taken to ensure accurate results.
- Using the preliminary experiment’s results, for every height put your eye level to where approximately the ball will bounce – this will improve accuracy of readings.
- Read off the bounce height with one eye closed (the same eye). This will result in clearer vision and so the bounce height will be easier to measure.
Secondary Sources
For this investigation I have used several secondary sources for the theoretical background. I have used material from these websites:
, , and . The illustration of energy transfer in bouncing balls is taken from . I have also used the book ‘Complete Physics’ by Steven Pople.
OBSERVATIONS
Results
ANALYSIS
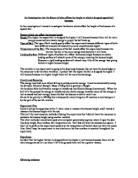
This evidence clearly shows that as the height the ball is dropped from increases, the height that it bounces to increases. However, the results are not directly proportional. As shown below the best-fit line is curved and starts at the origin.
Scientific Explanation
My hypothesis was slightly incorrect. I predicted that my graph would have a straight line through the origin. Instead, my graph was a curve, showing that when I was using the lower drop heights, more of the available kinetic energy was stored and used in the bounce. As the drop height increased, more and more of the kinetic energy in the ball is lost during the fall and collision with the ground and so the difference between the bounce heights gets smaller. The average bounce height starts increasing less and less the higher the drop height becomes.
I think this is because there is an energy-wasting factor that I overlooked. This was friction due to air resistance in my hypothesis. The higher the ball is dropped from, the more GPE it has to convert into Kinetic energy, and the faster the ball goes. As the velocity of a ball increases, so does the air resistance acting on it. The ball will lose much energy this way. When the ball is falling, it loses some kinetic energy due to friction with the air resistance. The faster the ball’s velocity when it is falling (i.e. the more kinetic energy it has stored), the more air resistance it will have and therefore the more kinetic energy it will lose with friction. Therefore, the higher the drop height, the more energy the ball loses while it is falling. Obviously, this makes the line of the graph gradually get less steep and form a curve.
However, the higher the ball was dropped from, the higher it bounced as predicted, as its original potential energy is transformed throughout the bounce, as shown in the diagram in the theoretical background. My prediction also supports the result that it didn’t bounce to its original height for the reason described in the theoretical background – energy is transformed during the bounce into wasted heat and sound energy.
EVALUATION
The procedure seemed to be accurate and to have gone well and produced results that backed up most of the hypothesis. There were no anomalous points on the graph. To try and make the experiment as accurate as possible, I measured height bounced three times at each height and then found an average. As there was a wide range of data, repeats and all points fell near to or on the best fit line, this experiment would seem to be accurate and reliable. The results that I gained for each height had no more than 1.5 cm between them, which shows that I performed this experiment well, and so results would be accurate.
From my background information, and from what I have discovered and noted in the analysis, I had enough evidence that I could study to work out why my graph was a curve instead of a straight line. I also feel that I had enough evidence to back up my conclusion. All my results did follow a pattern. I didn’t have any unexplainable results because I took enough tests and averages to even out any slight errors in the pattern.
However, I had to drop the ball more times than this from some heights, as the height that it bounced to was often unclear. I endeavoured to measure the height bounced to the nearest mm. However, at first, because my eye was not used to reading off the measurement that the ball bounced to, it was generally measured to the nearest 5 mm. To make the experiment more accurate, I should practise much more before doing the experiment. However, to totally eliminate the aspect of human error, a high-speed camera or a motion sensor could be used to get an exact measurement to the nearest mm.
Also, in the method, it stated that I would use my results to be at eye level to the approximate height the ball would bounce to from the height it was dropped. However, as the height the ball was dropped from increased, it was more and more difficult to drop the ball from the right height whilst keeping at eye level to the height it would bounce to. Also, the higher the ball was dropped from, the more it would bounce away from the ruler and make reading off the height it bounced to more difficult and inaccurate.
To try and improve this, I would set up a clamp next to the metre rules, and clamp the ball at every height, put my eye to the correct height, and then simply loosen the clamp so the ball falls. It will then fall exactly from the right height and will bounce as close to the rules as possible without hitting them. It will also allow the ball to be dropped with exactly the same force every time. Another idea would be to use one person to drop the ball, and one to measure the height it bounced to.
If I could extent this experiment even further, I think I would carry out the same experiment with a different ball. This way, I could relate the results I have gained with a ping-pong ball with results with, for example, a tennis ball. The pressure inside a tennis ball is different to that of a ping-pong ball. It would be interesting to see what difference this makes to the results. Also, the tennis ball is made of a different material. A tennis ball has a larger surface area than a ping-pong ball. I predict that air resistance has more effect on a tennis ball than it does on a ping-pong ball. Therefore I predict that the graph will look very similar in direction, but the graph for the tennis ball will start to curve more dramatically quicker than the ping-pong ball does. This is because the tennis ball will be losing more energy due to air resistance.
Another improvement on the experiment we did would be to calculate the energy lost when the ball bounced. We will measure the ball first and then work out the energy lost by doing this simple equation:
Gravitational Potential Energy= Mass × Gravity × Height.
Just before the ball hits the floor, the Gravitational Potential Energy is converted into Kinetic Energy.
Calculating power and work as an additional experiment could be another extension.
I could extend this experiment by looking at temperature as the variable as this would mean I could look at kinetic theory and see if I can prove it using the results form my experiment as there was no scientific model or theory that I could use in the experiment that I did.
NB all measurements are to one decimal place where appropriate