Equipment:
- 1 Voltmeter
- 1 Ammeter
- 5 wires
- 2 Crocodile clips
- 10cm, 20cm, 30cm, 40cm, 50cm copper wire of SWG 36
- 10cm, 20cm, 30cm, 40cm, 50cm of copper wire SWG 24
- 10 cm, 20cm, 30cm, 40cm, 50cm of nichrome wire SWG 32
- 10cm, 20cm, 30cm, 40cm, 50cm of nichrome SWG 36
- Power pack
Method
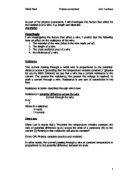
- Take all the equipment and set it up as shown in the circuit below
- Set the power pack on the lowest voltage possible (this is because if there is a high voltage ten the wire will burn and it will create a fuse so it as to be set on the lowest possible voltage)
- Place the wire in between the crocodile clips to complete the circuit
- Turn on the power pack and the voltmeter and ammeter
- Take down the recordings of the ammeter and the voltmeter onto the results table.
- Turn of the power pack and the ammeter and voltmeter
- Then change the wire to the next one.
- And keep on repeating until all the wires of the different lengths and the different SWG’s are completed. (that is all the 10 till 50cm’s of both the wires of all four SWG’s)
- Then using ohms law find out the resistance of all the wires
- Lastly using Microsoft excel plot the graphs and see if there were any anomalous results, or if the resistance increased or decreased and compare the results to the hypothesis
NOTE BEFORE while the experiment is going on make sure that the wires are not tangled or they do not loop just like the diagram below
This is because if the wire touches another part of the wire the current will skip and it will not flow through the entire wire which will not make the test fair and due to that, I will get anomalous results.
This plan is good because it gives the correct details and it is very easy to follow. Especially while carrying out the experiment. It also covers all the steps I need to follow so I am sure I will not miss out a step while I do my experiment
OBTAINING EVIDENCE
Before I start doing the experiment I will have made a record table already, this is so that it would be easier for me to record all the evidence I collect and so that I do not make a mistake in not recording the results of my investigation.
To collect the evidence I will need to follow the steps shown in the method. In brief I will need to set up the apparatus, turn on all the electrical components after the subject wire is attached, I will then record the results from the ammeter and the voltmeter onto my results table.
It is necessary for me to have enough evidence for the experiment so that I can make a very fair judgment and for this I will take two different wires and I will take two different SWG’s of each of those wires. Overall, I will have to test 20 wires each are different from each other by whether length, material it is made out of or by the SWG.
I got this result from doing the experiment (all results are to two significant figures)
Copper wire 24 SWG (thick wire)
Copper wire 36 SWG (thin)
Nichrome wire 32 SWG (thick)
Nichrome wire 36 SWG (thin)
Analysis
From the results that I got I will plot various graphs that will help me come to an end to this investigation and see whether my hypothesis was correct or incorrect.
Graph 1
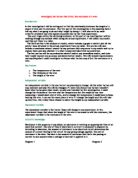
Graph 1 is a graph of the resistance of the copper SWG 24 wire against the length of the wire. From this graph, I can see that the resistance increases as the length increases. This means that the longer the wire gets, the more it will resist.
I did not get any anomalous results for this experiment as all the results I got fitted the line of best fit.
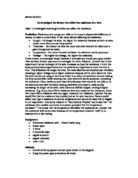
Graph 2
The second graph is a graph of the resistance of a copper wire of SWG 36 against the length of the wire. As I found out in graph one that as the length increases so does resistance, I got the same result in this graph but unfortunately, I got an anomalous result, the reading for the 50cm wire does not fit into the line of best fit. There are many reasons why this has happened and some of the reasons are:
- the wire was not in full contact with the crocodile clips
- As the wire was long it may have curled and touched another part of the wire that makes the electrons jump and this makes anomalous results.
- the wire could have been rusted or corroded which made it an unfair test as the electrons would not flow as properly because of the poor contact
- The wire may not have been cut to 50cm; it may have been cut to big or to small by mistake.
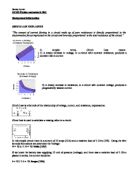
Graph 3
Graph 3 is a graph of the resistance of a nichrome 32 SWG wire against the length of the wire.
In this graph, as well I have noticed that when the length increases the resistance also increases. All the results that I got from this experiment are correct and they all fit the line of best fit.
Graph 4
Graph 4 is a graph of the resistance of a nichrome 36 SWG wire against the length of the wire. In this graph, I have noticed the same pattern that I have noticed in each graph and it is that as the length increases so does the resistance.
In the experiment that I conducted, I only got one anomalous result and that is from the copper 36 SWG wire. If I would repeat this experiment I would try and avoid making these mistakes by either making sure that the wire is new and not corroded, rusted etc. or making sure that it really is cut to the correct length. I would double check all the wires.
According to my hypothesis I stated that if the length increases the resistance would also increase and this is true because it shows very clearly on the graphs and on the results table that as the length increases so does the resistance. This is because as the length of a wire becomes larger more electrons need to pass through it and this means it will get hotter.
I will also need to find out which graph of which material has a larger resistance. To do this I will need to find out the gradient for each of the graphs and the graph which has the largest gradient is the one which has the largest resistance. To do this I will apply the gradient formula.
To find gradient you have to do Y/X axis, therefore in this graph it will be:
Change in Resistance (ohms)
Change in Length (cm)
Graph 1
0.375-0.05
45-25
0.325
20
=0.01625
Graph 2
0.3-0.125
30-10
0.175
20
=0.00875
Graph 3
8.0-4.5
45-25
3.5
20
=0.175
Graph 4
18-9
50-25
9
50
=0.18
From these result I will make a table to sum it all up, so that it is much easier for me to find out which one has the larger resistance.
From the table above it clearly shows that nichrome has a much higher resistance than copper and the nichrome wire which has a smaller SWG, is the nichrome SWG 36 wire. This wire has the most resistance. It has just over 110 times more resistance than the copper SWG 24 wire.
This is just what I had predicted before the experiment.
In my hypothesis, I also predicted that a thicker wire will have less resistance as compared to a thinner wire. To find this out I will need to calculate the cross section of the wire.
To do this I will be using only the copper wire of 20cm length. My only variable will be the SWG of the wire.
This is the results which I got from the next experiment to see whether the cross sectional area affects the resistance or not
All lengths are 20cm
To find the cross section for the wire I will need to apply a formula, the formula is A= r2
To find the radius (r) I will need to use the chart from the internet ().
SWG 24 = 0.558mm diameter
SWG 32 = 0.274mm diameter
SWG 36 = 0.193mm diameter
Now to find the radius I will need to apply the following formula: r=d/2
SWG 24
r=d/2
r=0.558/2
r=0.279
SWG 32
r=d/2
r=0.274/2
r=0.137
SWG 36
r=d/2
r=0.193/2
r=0.0965
Now that I know the radius of each wire I can find the cross sectional area by applying the formula A= r2
SWG 24
A= X(0.279)2
A= 0.245mm2
SWG 32
A= X(0.137)2
A=0.006mm2
SWG 36
A= X(0.0965) 2
A=0.029mm2
SWG 24 has a cross sectional area of 0.245mm2 as it has the lowest SWG it also means that it is the thickest wire. Where SWG 36 is a much thinner wire and it also has a much smaller cross sectional area of 0.029mm 2. This means that my hypothesis is correct. That a thicker wire has less resistance. I will plot a graph to see the relationship between the cross sectional area and the resistance of the wire. I will also find the gradient of the line. The graph for this is labelled as graph 5 in the graphs. As looking at this graph one can see that there is an anomalous result.
Evaluation
Evaluating the graphs
The results which I obtained were fairly accurate but as I said before in the analysis in two of the graphs, there is an anomalous result. This result is present in graph 2. That is the graph showing the relationship between resistance and length in a copper 36 SWG wire. There may be many reasons for this anomalous result. Here are a few suggestions why:
- the wire was not in full contact with the crocodile clips
- As the wire was long it may have curled and touched another part of the wire that makes the electrons jump and this makes anomalous results.
- the wire could have been rusted or corroded which made it an unfair test as the electrons would not flow as properly because of the poor contact
- The wire may not have been cut to 50cm; it may have been cut to big or to small by mistake.
There is also an anomalous result in graph 5. This is the graph on resistance against the cross sectional area of the wire. The anomalous result can be identified on the graph within an instant. There are also many reasons why there is an anomalous result in this experiment aswell. And they are nearly the same as the above
- the crocodile clips were not clipped properly
- The wire may have coiled up and jumped to make it unfair.
- The wire may have been rusted or corroded which helped prevent the flow of electrons consistently, which affected the result of the experiment.
- The correct size of wire may not have been used.
Improvement methods
If I would be able to conduct this experiment a second time I would do the following things:
- conduct a preliminary experiment first so that there is a rough idea of what the actual results should be like
- I would repeat each wire of each thickness of each length at least 3 times and then take an average. The main reason for this is so that it is quite certain that the results obtained are correct. The experiment which I conducted above did not have more that one per wire per thickness per length.
- I would make sure that none of the wires are corroded or rusted or bent, I will use brand new wires so that the best possible results are obtained.
Although it was not possible in this experiment for me to take more than one reading and then take out an average for it to put for my final result I should have checked my results thoroughly and repeated any experiments were the results did not seem normal.