Aim
To investigate how the mass of a margarine tub affects its stopping distance when the air resistance, surface and the elasticity of the elastic band are kept constant.
Prediction
I predict that as the mass of the tub is increased the stopping distance will decrease.
Explanation
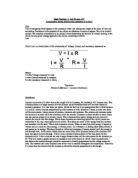
We did a piece of preliminary work on the computer software, where the mass of a trolley was changed and the launch speed measured. As the mass was increased the launch speed decreased. The elastic band was pulled back the same amount each time, giving a constant elastic potential energy each time. Kinetic energy is found using the equation ½mv2.
This can be rearranged to give KE = mass
½ v2
If the kinetic energy and the half are constant, this gives us the relationship m ∝ 1/v2
This is not the same as our experiment as we are investigating stopping distances. There is not a programme on the computer to change mass and investigate stopping distance, so we also did a second piece of preliminary work where the launch height was changed and the stopping distance measured. We were then able to link the two.
Gravitational potential energy is found using the equation mgh. This is transferred to kinetic energy, so we get the equation-
G.P.E = mgh = ½mv2
The mass is kept constant, and gravity does not change so we find the relationship h ∝ v2
From our graph of stopping distance against height we found that
sd ∝ h as the graph is a straight line.
So we have the three relationships –
m ∝ 1/v2
h ∝ v2
sd ∝ h
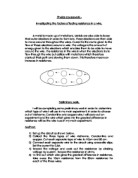
We then can find that m ∝1/h and from this we get the relationship m ∝1/sd. When plotting mass against stopping distance I would get a negative curve, because as mass increases the stopping distance decreases. As 1/sd is the inverse the graph will have a positive gradient. The graph would look like this –
Method
A tub will be collected and the mass weighed. The two elastic bands will be knotted together and fixed onto two chair legs. The margarine tub will then be pulled back 10cm and released. The distance will be measured from the point of release. It will then be repeated twice and then repeated for the next mass. To attach the weights blue tack will be used, so to keep the test fair it will also be stuck in the pot when there are no weights in it. The surface, air resistance and elastic potential energy of the band will be kept the same to ensure it is a fair test. The stopping distance will be measured using a meter rule, as we will be measuring to the centimetre. The test will be completed with weights at 0g, 20g, 40g, 60g, 80g, 100g and 120g.
Results
Analysis
The graph from these results (mass v stopping distance) is a curve, which shows an inverse relationship. This shows that as the mass increases the stopping distance decreases. According to my prediction, the graph of mass v 1/sd should be a straight line. Here are my calculations for this graph -
The graph of this is a straight line with a positive gradient. This gives us the relationship m∝ 1/sd The results strongly support my prediction as our graph clearly follows the pattern.
Explanation
Kinetic energy makes the object move. The elastic potential energy is transferred to kinetic energy, and the elastic potential energy was kept constant, meaning the kinetic energy was constant. Kinetic energy is found using ½mv2. If kinetic energy and the ½ are constant, we are left with m and v2. To find the relationship between these we have to rearrange the equation, and we get ke = m
½v2
So when we remove ke and ½ we get 1/v2∝ m.
Gravitational potential energy is transferred to kinetic energy. Gravitational potential energy is found by mgh, so we get the equation
GPE = mgh = ½mv2. The gravitational potential energy is constant, as is mass and gravity, so this gives us h ∝ v2. We can use this with m ∝ 1/v2 to get m ∝ 1/h.
From our preliminary work where we changed the height and measured the stopping distance we got a straight-line graph, giving us the relationship h ∝ sd. We can use this together with m ∝ 1/h to get
m ∝ 1/sd.
Evaluation
Our method worked well and we got good results. We took sufficient data to make a safe conclusion. We repeated each one 3 times and took averages to ensure our results were reliable.
On our graph of mass v SD we had one anomalous point, at 40g. It was lower than we expected, and if we look at the results you can clearly see that one of the results was a lot lower than the rest. This could be random data error as the majority of the results are accurate, and it is a very slight scatter around the line of best fit.
However on the graph showing mass v 1/sd we had two anomalous points at 60g and 120g. This again is probably random data error as the other points are very tightly scattered about the line of best fit.
To ensure our experiment was a fair test we kept a number of things constant. The elastic band was pulled back the same amount each time to ensure a constant EPE. If this were changed there would be more KE meaning the stopping distance would be greater. The slope of the surface was kept the same each time because if the tub was going down a slope there would be more GPE which would be transferred to KE. The friction was kept the same each time so that KE was not transferred to heat energy. Also if there is more friction the forces will be unbalanced and the tub will stop sooner. We used the same tub each time to ensure there was the same amount of air resistance each time. Air resistance acts with friction so if there is more the tub will stop quicker because the forces are unbalanced. We also used the same type of weights each time to ensure the masses were correct, and we measured the stopping distance from the same point each time.
One problem with our experiment was that the tub did not always travel straight forward, and we measured straight ahead to keep it fair. Another problem was that the tub did not always release the same. Sometimes it caught on the elastic band and a few times it hit the wall. To improve this experiment we would need to do it in an open space to prevent it hitting the walls. Another way to improve it would be to fit a holder onto the elastic band (see below)
Then the elastic band would be pulled back, the tub slotted in the holder and then released. The tub would move forward and would not catch on the band. This would improve the accuracy of the results.