Kelly Waites
Investigating Resistance
Aim
To find out the factors that affect the resistance of a wire. Also to find out the
relationship between resistance and length, and resistance and cross-sectional area.
Theory
The current flowing through a metal wire is proportional to the potential difference
across it providing the temperature of the wire remains constant.
Resistance (R) = Pd across the wire (V)
Current through the wire (I)
If a conductor obeys ohm's law, the current will increase in proportion to the
potential difference. If you double the voltage, the current will also double. If the graph of
the current against potential difference is not a straight line, or does not pass through zero,
then ohm's law does not apply.
The amount of resistance of a wire depends on many different factors. Some of
these factors are:
. Length
. Thickness
. Material type
. Temperature
Resistance is the opposition to a flow of electric current in a wire. Longer wires have
more resistance than shorter wires, this is because there are more particles for the electrons
to get passed from one end of the wire to the other because there is a greater distance to
travel. Energy is lost each time the electron hits an atom.
The friction that occurs between the electrons colliding into each other as well as the
atoms in the metal creates heat and heat is a major factor that effects the resistance of a
wire. The heat increases, the particles that make up the wire vibrate more, which means the
electrons lose more energy. This is because it is harder for the electrons to flow through the
wire without collisions. If the particles are cooler they vibrate less which makes it easier for
the electrons to flow through so they don't lose as much energy , resulting in a stronger
current.
The thinner the wire the higher the resistance. This is because all the electrons try to
push through the wire at the same time and collide into one another which also creates heat.
If the wire is thick then there is much more room for the electrons to flow through then there
is in a thin wire.
Different materials have different levels of resistance. For example, Nichrome wire
has more resistance than copper wire of the same size. There are two reasons as to why
current flows more readily through copper then nichrome:
. Copper contains more sufficient electrons (charge carriers)
. More mobility of the electrons (charge carriers) in the copper
Current passes easily through a piece of copper connecting wire, but it doesn't pass
so easily through the thin nichrome wire of an electrical fire element. This wire has much
more resistance so energy has to be spent to force electrons through it and heat comes off
as a result. If the temperature changes, so does the resistance. If a metal is warmed, its
resistance goes up.
The resistivity of a material is numerically equal to the resistance of a specimen of
length 1m and cross sectional area 1m squared when a current flows perpendicularly to that
area.
Resistivity is quoted in m or in cm; in the latter case it relates to a specimen 1cm
long and 1cm squared in cross-section. Conductors like copper have very low values of
resistivity while the plastics generally have very high values.
When the concept of density was introduced in Ch.10 it gave us the ability to
compare different materials in a fair way. Although different samples of aluminium and iron
could be lighter or heavier than each other there is no doubt that aluminium has a lower
density than iron. To get the idea of density we needed to fix a certain volume (a cubic metre ...
This is a preview of the whole essay
long and 1cm squared in cross-section. Conductors like copper have very low values of
resistivity while the plastics generally have very high values.
When the concept of density was introduced in Ch.10 it gave us the ability to
compare different materials in a fair way. Although different samples of aluminium and iron
could be lighter or heavier than each other there is no doubt that aluminium has a lower
density than iron. To get the idea of density we needed to fix a certain volume (a cubic metre
or cubic centimetre) and use this standard-sized sample for all materials. Therefore mass is a
property of any individual object but density is a property of the material of which it is made.
In a similar way we have resistance as a property of any object but we need to be able to
compare the materials of which different objects are made. As with the density case there is
a fixed standard size and shape so that fair comparisons are made.
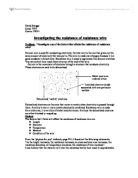
There are factors of size and shape that decide the resistance of an object. So
consider a thin rectangular-section piece of material with current flowing along its length. If
two such lengths were connected end to end they would be in series and therefore have
twice the resistance of each one separately. Therefore the resistance R must be directly
proportional to the length since when is doubled, so is R
Similarly, if two pieces were placed side by side so that the current could flow
through each of them they would be parallel giving a combined resistance of half that of each
one separately. Clearly the resistance must be inversely proportional to the area of cross-
section, A, since when A is doubled the resistance is halved:
Combining these two results gives:
or:
where P is the constant of proportionality and will have the units of resistance X length. This
constant, P, is called the resistivity of the material and from the equation we see that if =
m and A= 1m , p = R.
Prediction
I predict that the thicker the wire the less the resistance. I think this because it is a lot
easier for the electrical ions to pass through a wire with a wider cross-sectional area,
because there is more space for them to pass through resulting in less collisions.
When there is a wire with a small cross-sectional area there will be more resistance.
This is because there is less space for the ions to pass through so they collide into each other
not passing through as easy creating friction and heat, this also creates more resistance.
The longer the wire the more the resistance. I think this because there is a greater
distance for the electrons to flow through resulting in more particles to bump into along the
way, and the electrons lose more energy. If the wire was shorter it wouldn't take as long for
the electrons to flow through so they don't lose as much energy from the collisions that are
of a shorter period of time.
Plan of Action
I am going to find out what affects the resistance of a wire by using a six volt power
supply in order to have a sufficient charge that won't be too strong or too weak, also so the
wires won't get too hot very quickly as it would then greatly affect our results. Five different
thickness' of nichrome wire as well as changing the length. I will use 20,24,28,32 and
36swg and for each one I will record the voltage and the amps for the lengths from 100cm,
down every 20 to 20cm. Do this by setting up the equipment as shown in the diagram below
and change the wire after you have recorded all the results for the previous wire, doing so
for each one:
We will then use the results to find the resistance which is:
R=V Resistance = Volts
I Amps
I will then record our results on a graph. After that I will do the same thing but
record all the wires at 60cm three times to do an extra graph comparing cross-sectional area
and resistance.
Trial run
Below is a results table showing our first trial run of our plan of action so we can see
if anything needs changing. The wire used was nichrome-24swg.
LENGTH
(CM)
V
VOLTS
I
AMPS
R
RESISTANCE
V2
I2
R2
V3
I3
R3
00
4.78
.10
4.34
5.00
.15
4.34
5.02
.16
4.32
80
4.53
.31
3.45
4.55
.27
3.58
4.77
.39
3.43
60
4.30
.67
2.69
4.22
.58
2.67
4.39
.76
3.48
40
3.86
2.16
.78
3.70
2.07
.77
3.81
2.39
.59
20
2.85
3.25
0.87
2.85
2.85
0.07
3.07
3.23
0.94
The results do prove my prediction correct but to show it accurately I will change
my plan of action to going down in 10cm rather than 20cm. This will give me a wider range
of results.
Improved Plan of Action
I am going to find out what affects the resistance of a wire by using a six volt power
supply, five different thickness' of nichrome wire and the changing of length from 100cm,
down every 10 until I get to 10cm. The thickness' that I will use are 20, 24, 28, 32 and
36swg. For each thickness I will record the Volts and Amps from 100cm down to 10cm. I
will do this by setting up a circuit like the one below and changing the wire after I have
recorded all the results for the previous wire:
I will the use the results to find the resistance for each length of each wire using this
equation:
R=V which is .... Resistance = Volts
R Amps
I will then do the same as the above but only record all the wires at 50cm three
times to compare cross-sectional area and resistance. Then I'll do the graphs.
Apparatus
. Power supply, to supply the charge for the wires.
. 5m of nichrome wire, for the charge to travel through.
. crocodile clips, to connect the circuit.
. wire cutters, to cut the wire down to the desired lengths.
. metre stick, to measure the different lengths of wire.
. connecting wires, to carry the electric current.
. ammeter, to record the amps.
. voltmeter, to record the volts.
Fair Test
I will make sure it is a fair test by using the same bit of wire when we record the
50cm three times, letting the wire cool down before moving on to the next length because
heat creates more resistance, use the same amount of power for each wire so there are the
same amount of electrons passed into the wire each time. Also I will make sure the circuit is
connected properly at all ends.
Method
. Set up equipment as shown in diagram.
. Cut a 20, 24, 28, 32, and 36swg nichrome wire to 100cm using a metre stick.
. Start at 20swg and add it to the circuit.
. Start at 100cm record the results and move the crocodile clip down 10cm.
. Record the results from the ammeter and the voltmeter onto a table.
. Move the crocodile clip down 10 more cm's and so on until you get to the end.
. Change wire to the next gauge and gradually work your way through all of them.
. Repeat the 24swg three times at all lengths.
. For all the thickness' record the results three times at 50cm.
. Then find the resistance using the equation R=V/A
. Plot the graphs.
Safety Box
. Make sure bags and coats are in a safe place where nobody can fall over
them
. Walk in an appropriate manner around the laboratory.
. Leave the wires to cool before touching them
. Do not take water near the power pack and don't have the voltage too
high
Results
Nichrome-20swg
Length (cm)
V
volts
I
amps
R
resistance
V2
I2
R2
V3
I3
R3
Avg
. R
00
2.35
.32
.78
90
2.31
.41
.64
80
2.26
.53
.48
70
2.12
.64
.29
60
.97
.76
.12
50
.79
.89
0.95
.40
.56
0.90
.42
.53
0.93
0.93
40
.58
2.06
0.77
30
.42
2.21
0.64
20
.05
2.52
0.42
0
0.62
2.76
0.22
Nichrome-24swg
Length (cm)
V
volts
I
amps
R
resistance
V2
I2
R2
V3
I3
R3
Avg.
R
00
3.32
0.73
4.55
3.31
0.72
4.60
3.19
0.70
4.56
4.57
90
3.23
0.81
3.63
3.22
0.78
4.13
3.13
0.75
4.17
3.97
80
3.28
0.90
3.64
3.15
0.85
3.71
3.04
0.81
3.75
3.70
70
3.15
0.97
3.25
3.07
0.95
3.23
2.94
0.91
3.23
3.24
60
3.07
.08
2.85
2.97
.07
2.78
2.84
.03
2.76
2.79
50
2.91
.23
2.36
2.82
.23
2.30
2.70
.16
2.33
2.33
40
2.70
.41
.91
2.71
.26
2.15
2.50
.35
.85
.97
30
2.41
.65
.30
2.33
.66
.40
2.28
.60
.43
.38
20
2.02
2.11
.00
.94
2.13
0.91
.94
2.01
0.97
0.96
0
.38
2.78
0.50
.35
2.72
0.31
.28
2.61
0.49
0.43
Nichrome-28swg
Length (cm)
V
volts
I
amps
R
resistance
V2
I2
R2
V3
I3
R3
Avg.
R
00
3.32
0.44
90
3.37
0.37
80
3.35
0.42
70
3.18
0.45
60
3.14
0.52
50
3.00
0.59
5.08
3.01
0.59
5.10
3.03
0.58
5.17
5.12
40
2.78
0.67
30
2.52
0.81
20
2.20
.07
0
.72
.52
Nichrome32swg
Length (cm)
V
volts
I
amps
R
resistance
V2
I2
R2
V3
I3
R3
Avg.
R
00
3.50
0.18
9.44
90
3.22
0.36
8.94
80
3.53
0.25
4.12
70
3.48
0.26
3.38
60
3.40
0.29
1.72
50
3.30
0.35
9.43
3.23
0.36
8.97
3.26
0.33
9.88
9.42
40
3.10
0.40
8.50
30
2.87
0.49
5.86
20
2.60
0.63
4.13
0
.86
0.94
.98
Nichrome-36swg
Length (cm)
V
volts
I
amps
R
resistance
V2
I2
R2
V3
I3
R3
Avg.
R
00
3.54
0.19
8.63
90
3.47
0.22
5.77
80
3.42
0.24
4.25
70
3.35
0.27
2.41
60
3.32
0.31
0.71
50
3.25
0.35
9.29
3.27
0.33
9.90
3.29
0.32
0.3
9.83
40
3.06
0.44
6.95
30
2.91
0.50
5.82
20
2.55
0.74
3.45
0
.95
.10
.77
Evaluation
My results show that the longer a wire is, the higher the resistance will be and the
thicker a wire is, the lower the resistance will be. This is what I predicted and it has been
proved. The resistance in a wire depends on its shape and size.
The scientific reason as to why thin wires have a higher resistance than thick wires is
that the sea of electrons that flow throughout a metal all travel through at the same time and if
the electrons have a larger area to travel through then there will be more space for them to
flow freely with less collisions that cause loss of energy, but if they try to flow through a thin
piece of metal they will collide into the other ions creating heat which then creates more
resistance.
Longer wires have more resistance than shorter ones because a short wire has a
certain amount of resistance, now if you double the length of the wire then you will also be
doubling the resistance. This is because there is a greater distance for the electrons to travel
through so there is a greater amount of resistance slowing the current down.
The graph comparing length and resistance shows a linear trend, but I think we may
have made an error in the experiment. I think this because the line for the 32swg wire is
above the line for the 36swg wire when they should be the other way around. I suspect that
we may have used the same wire accidentally because the points for each result are so
close, but generally speaking the theory is proved because all of the others have followed
the expected pattern of an increase of resistance, in the increase of length and the increase of
thickness.
The graph comparing cross-sectional area with resistance shows that with
each increase in width of a uniform nature, the resistance drops, but by a greater amount
each time, i.e. 32swg-10
28swg-5 diff-5
24swg-2 diff-2
20swg-0.9 diff-1.6
If I was to do the experiment again then I would improve my method by being more
accurate with my measurements of the wire. The problem with the measurements before
was that the wires were very bendy and hard to straighten out so as a result the wires would
have been longer then the actual length recorded, so I would use straight wire and would
make sure it was cut to the nearest mm to get more accurate results.
Overall I am quite pleased with my experiment. The results were generally
successful and prove my prediction and the theory correct. If I could do it again then I
would make sure I had all the correct wires for each experiment, and that the wires weren't
too hot as to affect the results in a major way by creating too much resistance. I would do
this by leaving a longer period of cooling time so the heat will escape and the resistance will
drop. There was two anomalous results on the graph comparing length and resistance. The
reasons for these could have been an accumulation of not holding the crocodile clips at the
right places, e.g. At 50cm instead of 60cm, or the connections that sent the current through
the wire may have been held on tighter on one of the distances resulting in a stronger current
and less resistance, and loser on the next resulting in a lower current and more resistance.