Fair Test: - They’re so many variables used to ensure the accuracy of the results. Anything can affect results believe it or not even down to more carbon dioxide being exhaled near the plant.
Independent Variable
The independent variables are those that are to be changed during the experiment. The light distance will be changed during the experiment to prove theories and hypotheses. The distance will be moved about 6 times to maximise the scale of the results, also light intensity can be measured using a light sensor, as opposed to lamp distance.
Controlled Variable
The controlled variables will be the amount of pondweed used, the amount of sodium hydrogen carbonate used in the test tube for each experiment and the temperature of the water. These ensure that the amount of heat energy and carbon dioxide used do not affect the experiments results in any way.
Dependant Variable
The dependant variable will be the amount of oxygen produced and given off by the pond weed in the experiment that will be measured during the tests.
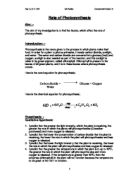
Range:
The distances that were used in each experiment had quite a large range. The smallest distance I chose to use was 10cm and the largest was 60cm. These had quite a large range as it will be a lot easier to compare results and notice how the light intensity changed as the pond weed was moved closer and further away from the pond weed. By using distances that were very different you can easily tell how the particles are moving. This is due to the factors that are being investigated as the lamp and the temperature of the boiling water are the same.
Each experiment that you have decided to carry out should be repeated more than once so you can make sure that your results are accurate and so when you find the range of your results they will correspond to the results you got from each experiment. By carrying out each experiment more than once you can also be sure that the controlled variables have remained the same and haven’t moved making the whole experiment not a fair test.
From each experiment of distances that have been experimented you can then find out the average. The average is found out so you can tell what the average amount of light getting to the pond weed for each distance that you have moved the pond weed closer and further away from the lamp. Finding the average is also helpful to find out as you are dealing with only one result for each distance rather than using all trails of the experiment to compare and analyze.
Preliminary work: Before the final experiment, some preliminary work has been done to back up a final coursework. Prediction. In this experiment, the amount of air bubbles have been counted coming from the cut end of the pondweed stem and to see how much oxygen can be produced in minute from three different lengths.
Preliminary analysis: From the results that were taken, the lower the intensity of light the less bubbles are produced. Therefore, photosynthesis occurs faster when more heat and light energy is available.
The results are still very much inconclusive due to the lack of results you can’t determine a line of best fit.
Preliminary Evaluation: If this experiment were to be performed again more oxygen would have to be collected and then measure the amount. In this experiment the light intensity reading would have to have been made thorough.
Prediction: From the preliminary work I can say that light intensity affects the rate of reaction in photosynthesis. The closer the plant is to the light the faster and more affective photosynthesis will take place.
The preliminary was of quite a lot of help leading into the final. It gave an insight into what to expect and they’re always good to find more efficient means of performing the experiment, you can alter things in order to provide fairer results.
You can then compare results of preliminary to the final results.
Materials:
The materials that were used to carry out and maintain a fair test in each experiment were:
- Light sensor
- Lamp
- Pond weed
- Boiling water
- Sodium carbonate
- Test tube
- Beaker
- Meter rule
Method:
- First of all get out all equipment needed for experiment to test rate of photosynthesis.
- Set up the light sensor, meter rule and the lamp and mark out 10cm intervals moving the light sensor, every interval getting closer to the lamp, which is positioned at one end of the meter rule.
- Record how much light is getting to the light sensor from the lamp every 10cm away. Make a results table and record these results.
- Get the test tube and put your piece of pond weed into it. Fill it half way with water covering the pond weed.
- Get the beaker and fill it half way with hot water which can be kept the same at the start of all experiments.(from the kettle)
- Place the test tube inside the beaker.
- Place the beaker and test tube on the first interval you have chosen to start on the meter rule and place the lamp at the end of the meter rule keeping the lamp head at the same position every time you repeat the experiment.
- Add in the 3 spatulas of Sodium Hydrogen Carbonate which you have decided on into the test tube.
- Record the distance away from the lamp the pond weed is and start the timer for a minute and record the number of bubbles produced.
Experiment Set Up
Final Experiment results
Analysis:
The results that have been retrieved from each experiment and all the trials show good detail and accurate, positive results. The results show that the prediction made was correct. What was conclusive was that the higher the light intensity and the closer the lamp the greater the rate of photosynthesis The further away the pond weed is from the light sensor the lower the Lux reading showing that light intensity has decreased.
What is noticeable in some of the graphs are anomalies which are just blips more than anything, in test two 50 centimetres away, I counted 21 bubbles, 10 centimetres back and I counted 24 bubbles, Just an anomalies.
The link is clear between light intensity and oxygen rising from the severed end of the plant. The greater the amount of oxygen bubbles that were produced means that the amount of effective collisions were being made were a lot higher, the reason being that there is more energy being created therefore more collision. Breaking the old bond, making a new substance.
The results came out as well as they did because it was made sure that it was a fair test every time. The lamp head position remained in the same position throughout the experiments and the temperature of the water in the beaker also remained controlled at the same level.
The results from all the experiments that took place were completed in all the same conditions so the experiments were a fair test.
The amount of sodium carbonate that was put into the pond weed helped a great deal with the results. The bubbles appeared quicker so it didn’t take a long time for the process of photosynthesis to start and waste the part of the one minute of time that was had there is a slight downfall to this, if too much of the sodium carbonate solution it clouds the tube causing confusion between bubbles and sodium carbonate particles. Therefore this means that there was an increase in the amount of bubbles that were produced rather than the preliminary results.
The line of best fit compares each experiment and how it compares with other results from different experiments with different ranges of distances. The results of each trial show a positive correlation of distance from light to pondweed and the number of oxygen bubbles produced per minute. From reading this graph, the results show that the lower the distance, the higher the light intensity.
Evaluation:
The quality of the results that were received was of a good standard. They gave out a general pattern which could then be compared and evaluated. Although the results were not as accurate as they could have been as the average results of each experiment which were recorded, shows that some results were a bit out. From the line of best fit which is situated on the graph which shows how we can compare the results to what the accurate results could have been. Most of the results show a good pattern as they are all equally spaced from each other. Therefore this shows that the results were accurate as because from the prediction, the closer the plant is to the light the faster and more affective photosynthesis will take place.
This shows obvious results and the prediction proven right. This is because the closer the plant was to the lamp the higher the intensity, this caused the particles to move more fiercely as there was more energy provided. We did three trials for each experiment to make sure we were carrying out the experiment accurately; you can compare the results to see the results were mainly consistent in all three.
In some of them, the variables could have differed slightly due to human error changing the results hence the anomalies. This proves that the prediction is correct as when one of the variables of each experiment changes so will the other causing different results. This will happen due to the particle theory. The particle theory will affect one of the variables so this will also have an impact on the other variable as old bonds are being broken and new ones are being made.
The first and second trials of each experiment show that there was quite a difference between the number of oxygen bubbles produced. This could be due to inaccurate counting or inaccurate conditions.
Next time I would use distances that were not as far apart. E.g. 5cm. This is because you wouldn’t have such a range of results to compare and you could see there would be less of a difference to the results.