In this investigation the distance from the light source was the independent variable and the amount of bubbles was the dependent variable.
Results
Decisions made from Trial Experiment
From our trial experiment there were two improvements we made. Firstly, we decided to put a glass sheet in between the lamp and the test tube as the water was beginning to heat up in the trial. As we are aware that heat can greatly affect experiments we decided it was best to eliminate it as much as possible.
Secondly, we decided to use Sodium Hydrogen Carbonate water in our final experiment. We decided this as we felt the plant was not respiring quickly enough so there was not a very clear range between distances. By using this water it meant that ALL the distances would have a fair chance as the water was the same concentration in all attempts. This would mean the plant would have more than enough carbon dioxide available to it, meaning Carbon Dioxide could not become a limiting factor.
We also made decisions relating to distance and repetitions. We decided that we would place the clamp stand at every 20cm from 0cm-100cm. We decided to take 4 readings at each distance and then average it for our final results and graphs.
Final Experiment
Equipment
Clamp Stand
Boiling Tube
Water Weed
Sodium Hydrogen Carbonate Water
Lamp
Metre Rule
Glass Sheet
Scissors
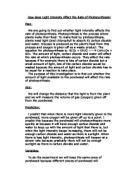
Method
- Set up equipment as diagram below.
Figure 3
- Measure out 40ml water using a measuring cylinder and 10cm water weed using a ruler and scissors. Place both in test tube.
- Move clamp stand along metre rule to distance required.
- Turn lamp on for one minute and count bubbles.
- Record and repeat for 3 further minutes.
- Repeat steps 3-5 for each necessary distance.
How I worked accurately
In this experiment the independent variable was the distance from the light source and the dependant variable was the amount of oxygen produced.
Control Variables-
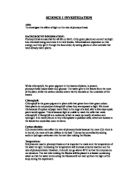
Light Wavelength (colour) - Light energy is absorbed by pigments in the leaf such as chlorophyll. Chlorophyll easily absorbs blue light, and also easily absorbs red light. Chlorophyll does not absorb green light or yellow light effectively but tends to reflect them, decreasing the amount of light absorbed and decreasing the rate of photosynthesis. The light colour can be fixed by using the same lamp throughout the experiment.
Carbon Dioxide- CO2 concentration can affect the rate of photosynthesis since the more CO2 in the air, the more CO2 that can diffuse into the leaf. This variable can be fixed by adding a fixed amount of sodium hydrogen carbonate to the beaker and plant which is what we have done.
Water- Water is required in the photosynthesis reaction. When plants lack water, their stomata close to prevent further water loss. At the same time, closing the stomata cells doesn't allow CO2 to diffuse into the leaf. Water is also therefore, linked to the carbon dioxide factor. Water can be kept a constant by keeping the same amount of water in the boiling tube.
Temperature- Enzymes are used in photosynthesis and the respiration of the plant. Therefore, increasing the temperature will increase enzyme reaction and the photosynthetic rate until a certain point is reached when the enzymes denature. The temperature can be kept constant by performing the experiment in one session, when the air temperature shouldn't change enough to affect water temperature. A transparent glass sheet will also be placed in front of the lamp to retain some of the heat from the lamp.
Plant- Different species of plants have different rates of photosynthesis due to the different leaf structures of the plants. Even plants of the same species may have slightly different rates of photosynthesis since there may be more or less chlorophyll in the leaves to absorb light. The size of the plant is also important since this would affect the amount of surface area for gas exchange. The only way to control this variable is to use the same plant throughout the experiment.
Limiting Factors- Light, carbon dioxide, temperature, and chlorophyll are all limiting factors, meaning that even when there is surplus of every other variable, the rate of photosynthesis will be limited by the limiting factor until there is enough of the limiting factor to increase the rate of photosynthesis further. Otherwise, the rate of photosynthesis can no longer increase.
Results
The rate of photosynthesis used in the previous table is worked out using the following formula:
Rate = average number of bubbles × 100
60
Conclusion
From the results that I have gathered I can state that an increase in light intensity certainly does increase the rate of photosynthesis. As was also expected in my prediction, the relationship between light intensity and the rate of photosynthesis was non-linear. From both graphs there is a best-fit curved line. This means that the rate of photosynthesis increases at an exponential rate.
However, my prediction that light intensity is inversely proportional to the distance squared did not fit into my results perfectly. The rule existed but there was often quite a large margin of error.
When measuring light intensity in terms of distance, the greater the distance, the slower the rate of photosynthesis. While the rate of photosynthesis was decreasing, the rate at which it was decreasing at was also decelerating. This is where the line in graph 1 was straightest.
The straightening of the line in graph 1 can be explained by the fact that light intensity is inversely proportional to the distance squared. This means that as distance increases the light intensity decreases at an exponential rate. If light intensity decreases exponentially, photosynthetic rates that depend on light intensity also decreases exponentially. The line in graph 1 would eventually reach "0" where photosynthesis stops as light intensity limits this rate.
This happens because:
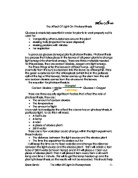
For a plant to photosynthesise it needs certain substances. These substances are shown in this equation:
Light
CO2 + H2O C6H12O6 + O2
Chlorophyll
Light
Carbon Dioxide + Water Glucose + Oxygen
Chlorophyll
Light is needed to drive this chemical reaction. The more energy that is put into a chemical reaction, the quicker the substances react, therefore a larger end product (including the waste product-bubbles) is produced.
Light is absorbed by chlorophyll in the chloroplasts in the palisade cells (see figure 1). Light, carbon dioxide, temperature, and chlorophyll are all limiting factors, meaning that even when there is surplus of every other variable, the rate of photosynthesis will be limited by the limiting factor until there is enough of the limiting factor to increase the rate of photosynthesis further. Otherwise, the rate of photosynthesis can no longer increase. This means that after a certain point the plant can no longer photosynthesise any more efficiently without one of these factors being increased.
Unfortunately we cannot measure the amount of Glucose being made due to limited facilities and time constraints so the waste product (oxygen in the form of bubbles) was measured.
Evaluation
Overall, I would state the experiment as a success since my predictions were supported by my results. Just as important is where the experiment was not a success and why. This photosynthesis investigation was probably not performed as accurately as it could have been due to some controllable and uncontrollable conditions. Some mistakes can be corrected.
I found I had only one anomalous point (the rest were all within one square of the line of best fit).This anomalous point is in the 40cm distance and is marked on both graphs. I believe my readings were fairly accurate because I took four readings and then took an average. I believe the one anomalous point may have been caused by the plant (unfortunately one cannot control a living thing), while performing the experiment, the piece of pond weed did not photosynthesise at a steady rate, even when the distance from the plant to the light source was kept a constant. However, by taking four readings I believe I received a quite high standard of data. A large factor in determining data accuracy is the amount of human error during experiments. The rate at which oxygen bubbles were being produced by my plant was so high at times that I found it difficult to count the amount of bubbles. I estimate a margin of error of at least 3 bubbles for each reading taken when the plant was close to the lamp. To improve the accuracy of the results, the readings would have to be taken several more times. The entire experiment could have been performed again, and the new results could be combined if the same plant is used. A better idea would be to actually measure the volume of oxygen being produced. This would help as when counting the bubbles I noticed some where larger than others, this could even have caused my anomalous point. During the high intensities I experienced difficulty counting the bubbles being produced. There are also factors affecting accuracy at low light intensities. With low light intensity, the pond weed receives some light energy from background light such as sunlight seeping through curtains or the light from the lamp of another student's experiment. To eliminate most all background light, the experiment must be performed in a completely dark room. Even then, some of the light from the lamp in my experiment would reflect of the table and reach the plant though this amount of light is probably insignificant in affecting the rate of photosynthesis.
Temperature was also another factor that was controlled by the lamp being used. Even though a glass sheet was used in front of the lamp to prevent some heat from reaching the plant, not all the heat can be blocked. The extra heat, however, did not affect the temperature of the water significantly, as it stayed at 21°c.
The method of the experiment could probably also be improved to obtain more reliable results. As already mentioned, the volume of the oxygen produced could be measured. Due to the high rates of photosynthesis of the pond weed, readings should be taken within shorter time periods. I had originally chosen to count the number of bubbles in one minute but this produced miscounts in the readings. If during a repeated experiment, counting bubbles is still used, there is a smaller chance for human error when counting within a smaller time frame. If the measuring volume option was to be chosen, volume should be measured for a smaller time frame to reduce the overall time to complete the experiment. With low light intensity, the pond weed receives some light energy from background light such as sunlight seeping through curtains or the light from the lamp of another student's experiment. To eliminate most or all of the background light, the experiment must be performed in a completely dark room. This could be achieved by using a photographic dark room. The experiment could also have been improved by using pond water at about 10°c to mimic the natural habitat of a pond weed.
To take this experiment to a higher level I think it would be interesting to investigate the effect of different wavelengths of light on the plant. This is relatively simple to do as it involves very little change to the original experiment.
This could be achieved by:
●Using the same set-up as in our experiment
●Inserting a different colour filter between the lamp and the plant
●Measuring the amount of oxygen produced at each distance and repeating the experiment at least three times so as to provide reliable and usable results
●Graphing wavelength against volume of oxygen produced.
However, in this experiment green light CANNOT be used as the plant would reflect the wavelength and not receive any light to fuel the reaction. I would predict the plant would react best to the wavelengths at the two extremes of the spectrum (red and violet).