Fair Test: These are the things that will make my experiment a fair one.
- Use lagging to keep heat in. This will make more heat stay in the caloimeter thus making the experiment fair.
- The first variable, which is time. I will make sure that the time is the same each time the experiment is run. This is 5 minutes per experiment. This will make it more accurate.
- The second variable, which is temperature. I will male sure that the temperature will start of at the same temperate each time but the end temperature will vary depending on the experiment. This will make experiment more accurate.
- I will cool the equipment before I start the next run. This will make sure that all runs start at the same temperature thus making the experiment more accurate.
- I will keep the water the same amount for each experiment. This is 200ml.
- I will use a variable resister. This is because it keeps the volts, amperes and current at the same rate throughout the whole experiment.
Preliminary results:
I have made a set of preliminary results. These were made in advance of my final set of results. These can be found above. From these preliminary results I can say that my experiment is accurate and does not seem to have any basic falls. Because of this I do not see the need to change any part of my experiment. So this is the basis I will use for my final experiment.
Prediction: From my general knowledge of science and this topic, the research I have made for this experiment and the preliminary test run I can know make a prediction for my experiment. I predict that the temperature will go up as the time increases. I also expect this to be directly proportional to time. The longer period of time there is the higher the temperature will be. I know this because when a substance is heated its particles move at a quicker rate. This causes more collisions between the particle thus making it heat up quicker. So I predict that on average the temperature the water will rise by 1oc every 1 minute. I believe this will happen due to the convection currents that occur when a liquid is heated.
So I predict that the time it takes for the rise to happen is directly proportional to the temperature. I believe that the exact temperature rise will be 14.286oC. I worked this out like this:-
Power = Voltage x Current
So … 7.71 x 2.65 = 20.4315
Energy = Power x Time
So … 20 x 600 = 12000
Energy Transfer = Mass x Specific heat capacity x Temperature
So 16000 = 0.2 x 4200 x 14.286
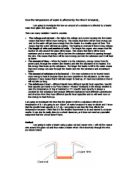
The heat energy being given out by the electricity and is used to power and heat the water.
Formula: Energy Supplied = Energy Gained
Energy transferred = Mass x Specific Heat Capacity x Temperature Change
V x I x T = M x C x x T
Observations:
I have not changed my experiment in any way from my original plan. I have completed the experiment following the rules set in the previous section. Here are the final results for my experiment.
Analysis:
After completing the experiment and getting my results down on the table you can see above. I decided to put my results onto a graph. This would make it easier for me and others, to read the data and also to evaluate and analyse the information.
So from looking at the graph and the table of results I can describe the results that I have gained. From the table and the graph I can tell easily that the total temperature rise is 10 oC. This is taken from the average results. Both the experiments started at the same temperature 23 oC but end up with different final temperatures. The results my group has gained are accurate and reliable. They all go up at a positive gradient on the graph and the numbers always go up never decrease. I have used a variable resistor so all the amperes and volts the same. This means the results for the two individual experiments will be very similar.
On the graph there is one pattern that stands out more than any other. The points on the graph are directly proportional to the time. The points all increase and it is a generally diagonal line from zero minutes to seven minutes but from then on the increase in temperature is a lot higher meaning the points are at a steeper gradient. But on the graph you can see a very clear straight line. This line is the line of best fit. It runs through the graph showing the average line of all pieces of data. This is the only real pattern you can see. The longer the water was heated the hotter the water got.
I predicted that the temperature would rise on average one oC every minute. I predicted that the temperature would rise 14.286 oC in total over the ten-minute period. Temperature is a measure of the average kinetic energy of the molecules of a substance. An increase in temperature results in an increase in the kinetic energy of the molecules and an increase in thermal energy. It is fair to say that temperature and thermal energy vary directly, but they are not the same things. I believe that my prediction was accurate because it matched my results that I gained. The factors that affect the amount of heat are the same as the factors that affect thermal energy, for reasons that should now be clear to you. Thermal energy is only measurable as heat, during heat transfer.
Evaluation:
So, as you see from my graph and table, temperature is one of the factors that affects the thermal energy of a substance. What is heat? Heat is the transfer of thermal energy from a hotter to a colder object. What we think of as "cold" is really the absence of heat. An object with at a higher temperature can release more heat than the same object at a lower temperature, but temperature is only one of the factors that affect the amount of heat an object can transfer. As the is heated up by the flame the water particle begin to move. They move around in a convection current and the hot water particle move to the top pushing cold water particles around and down. I believe that the results are reliable and accurate because I took an average from two experiments so this would cut out human error. Mt results also seem to go along with my preliminary and predictions I made earlier on. I believe that the results are good and I believe that my experiment on a whole was a big success.
Despite my experiment being a success there was still a few anomalies or anomalous results. These anomalous results were not major, but are still noticeable and were made aware to me when I was analysing my graph. The anomalous results occur during the early stages of the experiment. This is because it takes time for the immersion heater to fully heat up. So the time it takes for it to do this will affect the results. So all the times before the immersion heater was fully heated are anomalies. This is the only real anomalous result during my experiment.
There I only one good thing I could do to get over this problem. This Is to wait for the immersion heater to heat up fully. This takes about 7 minutes. I can tell this by my graph because there is a sudden rise in temperature and this is because the heater is fully heated. If I wait for my immersion heater to heat before I start the experiment my results would be more accurate and I would not have an anomalous result in my experiment. This happened because I had a small time scale in which to do the experiment so I could not spend time waiting for the experiment to heat up before I could start doing anything.
In the future if I had the chance to do this experiment again I would make the following improvements to the experiment. I would give myself a larger time span to do the experiment in. This would allow me to heat up my equipment as required and also making my experiment more accurate.