Investigation into how light intensity affects therate of photosynthesis.
Investigation into how light intensity affects the rate of photosynthesis
DRAFT
The aim of this activity is to observe and justify how the amount of light intensity exposed to a plant affects the amount of photosynthesis the plant performs.
I am trying to investigate the affect of light intensity on photosynthesis on a plant.
My hypothesis is that as the light intensity on the plant increases, the photosynthesis the plant performs will also rise proportionally. However I also hypothesize that when a certain level of light intensity is reached, the rate of increase will itself decrease. At this point temperature may become a limiting factor, which there is no control of.
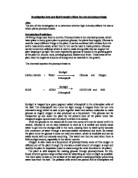
I think this will happen because my scientific research shows that the formula for photosynthesis is:-
6CO2 + 6H2O +light = C6H12O6 + 6O2
Carbon Dioxide + Water + LIGHT = Glucose + Oxygen
Light is needed along with Chlorophyll to create a chemical reaction so that this conversion can take place. Without light, this cannot happen, and chlorophyll, found in chloroplasts can not convert water and Carbon Dioxide. The light comes as light energy and is converted into chemical energy to convert the water and C02 into Glucose and Oxygen, which is just a by-product. Furthermore, because of this, the greater the amount of Light , the more conversion there would be taking place and the quicker it would take place. Because of a greater intensity of light, there would be a greater amount of chemical reaction in the same or smaller amount of time.
However, a limiting factor is also needed to be seen. In this case it may be Temperature or Carbon Dioxide, as they are too needed to be in absence or in gain for the experiment to be seen as a success. Because of the bulb to be used in the experiment, a lot more heat is given out and will therefore limit the factor of photosynthesis. Sodium hydrogen Carbonate gives the plant carbon dioxide so it can use the gas to actually execute photosynthesis. It gives the Stomata the carbon dioxide when reacted with water, to help Photosynthesis. Because of this, there is a constant supply of Carbon Dioxide.
With all of this knowledge, it must also be recognized that respiration also takes place at the same time and respiration itself used up oxygen to create more carbon dioxide. Thus, the count of bubbles could be severely disrupted because of oxygen usage.
Because Elodea plant is water-based it must be kept is a full tank of water, or the intake of Carbon Dioxide will differ.
One of the main factors that will lead to anomalies is temperature. This will most likely be created heat by the lamp. There will therefore be a temperature which the enzymes cant endure and will die. They will not convert anymore. The molecules in the cells would move faster kinetically and come to a point where they die.
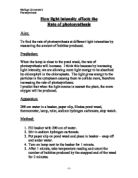
During the experiment, I am going to need: -
. A desktop lamp and bulb
2. A plant
3. A ventilated environment
4. A flask
5. Water
6. A meter rule
7. Stop Watch
8. Sodium Hydrogen Carbonate
9. Spatula with spooned end
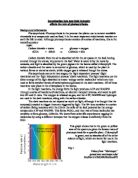
For safety reasons, I will make sure that the bulb of the lamp is not touched, because it can become very hot. I will ensure that water does not reach the mains because of a hazard of electric shock. The water must not spill on the floor, as one may slip on the spilt water. Wires will be not crossed or placed where people can trip over them.
I will set up my experiment in the way shown.
Fair testing is very important, so the variables that are kept constant are Co2 levels. These levels will be kept the same by making sure that there is a period between the different experiments where there is not light so the plant can respire and convert the oxygen back into carbon dioxide. The amount that the lamp will be moved forward by will remain constant at 5 cm every time. The water will be kept at constant temperature with a thermometer. It will be done so that, ...
This is a preview of the whole essay
I will set up my experiment in the way shown.
Fair testing is very important, so the variables that are kept constant are Co2 levels. These levels will be kept the same by making sure that there is a period between the different experiments where there is not light so the plant can respire and convert the oxygen back into carbon dioxide. The amount that the lamp will be moved forward by will remain constant at 5 cm every time. The water will be kept at constant temperature with a thermometer. It will be done so that, should there be a significant change in temperature, there will be ice or Bunsen flame used to render it. The amount of water will also be kept constant during the entire experiment. The amount of Sodium Hydrogen Carbonate added will also stay constant as one small spatula size.
Input variables are Carbon dioxide, water and Distance of Lamp (light)
Output variables are amount of bubbles produced (oxygen)
During the Experiment, I will look for the amount of bubbles that will come out from the plant. I will also look for speed of the exertion, although not in as much detail. I will look out for noticeable temperature increases by feeling the beaker. The size of bubbles will not be noted as in this experiment.
Preliminary work shows that I will move the lamp 10cm at a time, as this is a suitable length to find a subtle difference and not a very small one. There will also be a rate at 10cm and finish at 50cm. This is because there is more noticeable effects during this. If it is done with 1cm or 2cm, it would take more time and there would only be subtle differenced in one minute. However at 10cm changes, in one minute changes are very noticeable. One minute is the measure used because it is needed to fit in many trials to create an accurate average.
The method of doing the experiment exceeds as follows: -
* The water will be put in a beaker - only 500cm cubed
* 5cm of elodea plant will be added, it will be cut to 1cm accuracy
* A paperclip will be added to the plant so it does not float on the top and it has extra weight
* A small bit of sodium hydrogen carbonate will be added with the spooned end of a spatula - this is to create carbon dioxide for the elodea
* The lamp will be plugged in and switched on, it will be put 10cm away from the beaker. A meter ruler will be used to measure the distance.
* The amount of bubbles will be counted for 1 minute.
* Then it will be moved another 10 and the same procedure done. After it is done, it will be moved back further until 50 cm
* The process will be repeated 3 more times.
* An average will be found, and this will be plotted and analyzed.
Observations
Modifications made were to turn the lamp on its side so that the water got more light in proportion instead of just the top of the water. The plant was cut into 5sm and a paperclip was added for weight; hence, the plant did not float. The experiment was repeated 4 times to increase accuracy of the average of the experiment.
The results of the experiment were as follows: -
Distance
(cm)
Experiment one
Experiment two
Experiment three
Experiment four
Average
0
51
56
52
53
53
20
30
30
31
30
30.25
30
4
3
5
3
3.75
40
6
7
7
6
6.6
50
4
4
3
4
3.75
This experiment was done with 1cm of time for each attempt and distance from the lamp. The amount of bubbles emerging from the plant was counted. This was equal to the amount of bubbles of oxygen. The plant used remained constant.
Analysis
The graph was shown on the last page.
I hereby conclude that as distance from the plant increases, the amount of bubbles (oxygen) increases in proportion. Therefore a greater amount of photosynthesis occurs when the amount of light increases (when the lamp is nearer).
My graph shows a proportional relationship between distance of light, and amount of bubbles produced. Therefore, more oxygen is produced. However, the line of best fit is not linear. It is a curve of best fit. Therefore, the amount of oxygen and photosynthesis increases very quickly. The smaller the distance of the lamp from the pondweed, the bigger the amount of light and therefore there is a fast rate of photosynthesis. However, the further the distance, the smaller the amount of light and therefore a slower rate of photosynthesis. At 50cm, the rate of photosynthesis is lower, and it is near enough to being horizontal, and therefore constant.
This is because, as the amount of light increases, there is more light energy going into the plant, the chlorophyll absorbs this, and it is converted into chemical energy so that chemical reactions can take place. The actual formula shows how this then converts carbon dioxide and water, via chemical reaction, into Oxygen and Starch (glucose)
Carbon Dioxide + Water + Light = Oxygen + Glucose.
The increased amount of light means the energy is absorbed and converted at a faster rate, and so more bubbles of oxygen are produced. However, there are limiting factors present. These can be the amount of Carbon Dioxide, respiration taking place and also temperature. As the lamp is so close at 10cm, it is possible there is more heat. This can create a limiting factor, so that the amount of oxygen does not go very high, and can cause anomalies. At 50cm, there is less heat but also less light, so less photosynthesis takes place and therefore, there is a lower number of bubbles. There is less energy to be absorbed, and so there is less energy to convert the Co2 and H20.
If I compare my results with my prediction, I can see that I am right. I predicted that as the distance between the lamp and the plant increased, so would the amount of bubbles and therefore oxygen. I also predicted that there would be limiting factors, and there seem to be none at 10cm. So I am wrong here, there is no sign of slowing down, as the amount of bubbles between 10, 20, 30, 40 and 50cm are gradually getting smaller. The factor of light stops this. Less light means a lesser rate of photosynthesis. However, had I done 5cm or 1cm, I would have seen that the factor of temperature would have become limiting. Also, there is a limiting factor at the bottom, where it is a curve. It could be here that the carbon Dioxide levels are running out so less photosynthesis can take place. Therefore there is a limiting factor, but not where I had predicted.
In addition, the amount of carbon dioxide used via the Sodium Hydrogen Carbonate could all be used up after 5 simultaneous experiments. It could therefore be a potential limiting factor for the further distances that were done last.
The elodea plant does not have stomata pores, and so therefore absorbs all Carbon Dioxide from its surroundings. This takes a longer time and could be a potential factor.
Also it is to be noted that oxygen is a by-product of the chemical reaction to create glucose. There is more scientific background information in the plan after the hypothesis.
Evaluation
If I repeated the experiment, I would change it by : -
Because of the background light of windows, and other experiments aswell as ceiling lights, the experiment could have been done in different rooms under dark light and window blinds shut.
There should have been more experiments in different beakers and with timing for the different distances for the plant to have equal amounts of carbon dioxide. Each distance could have been done in different beakers so each plant could have the same amount of carbon dioxide so it would not run out.
Accuracy could be improved. The plant could be cut to a more accurate length, possibly in millimeters. Also, the accuracy in amount of bubbles could be increased, by doing the experiment for longer. A stopwatch could be used for greater accuracy. Also, the lamp could be measured more accurately and at smaller lengths to identify more accurate changes in the oxygen levels and photosynthesis. Also, the accuracy of the Sodium Hydrogen Carbonate could be greater by measuring it out and then adding it.
A plastic screen could be placed between the beaker and the lamp in order to absorb or reflect any heat so temperature would remain less distorted. I would also monitor temperatures of the water next time to make sure there is not great increase.
Also, if I did it again, I would use light intensity instead of distance for a greater accuracy and formality of the experiment. Distance is not a very accurate factor. Also, with the lamp shade present not much light gets everywhere. So a lamp without a shade would be used next time.
Bubble size could be noted down to have a little bit greater accuracy, although it would not be too much more accurate.
I would also try to use a closer measure of distance to the plant and not leave it at 10cm. I would try to go down to 1cm or 2cm. This would be to see the temperature factor taking effect more closely.
My experiment was good because of all the four times I did it, the results were more or less the same. There was some degree of accuracy used and the limiting factor was not too limiting during the experiments. There was a lack of anomalies which was good, and showed that what was done was accurate and that it did work. Also, I tried to stay away as far as possible from other experiments to avoid background light and blinds were shut, so light was stopped from there. Also, I used an accurate to 1second degree of time, so this was accurate.
The things that made my experiment unreliable were: -
The fact that the plant was respiring at the same time. So because of this, oxygen was being used to create more carbon dioxide. This would have meant inaccurate results, and the fact that some of the oxygen was dissolving into the water actually enlarged the problem. There is a problem with this. It could have been the cause of less bubbles erupting than there could have been. Respiration could have been a limiting factor.
Also, because of the lamp shade, most of the light at larger distances would have been spread out and the area of the light on the beaker would be less concentrated than at smaller distances. Background light could also be a problem, interfering with the photosynthesis.
The lamp itself let off a lot of heat, and so temperature could affect the enzymes involved in creating the glucose and Oxygen. This could be a limiting factor, although it was not much of one in this experiment.
Accuracy of distance, amount of Sodium Hydrogen Carbonate, size of elodea and time were not very accurate. Millimeters shpuld have been the measurements for the size based ones and milliseconds for the time. Although this would not have really changed results, these could have been factors that stopped more photosynthesis happening.
The Sodium Hydrogen Carbonate could have been in short supply, and carbon dioxide would have run out on the later experiments at 50cm or so. This could have been a potential limiting factor.
There are not many anomalies in my experiment except for the one right at the end at 50cm, where there seems to be a big sharp curve. This is 3 units vertically up from the line of best fit. This could be caused by a limiting factor. Although this has happened, there is not much light intensity here and so this might not be an anomaly It could be common place because of a factor such as distance of the lamp too. However, there is one clear anomaly. It is at 20cm, and is 2 horizontal units out of place. This could have been caused by a heat problem - mainly caused by the lamp, where the enzymes could be stopping because of false conditions to work in. Also Carbon Dioxide could be in short supply, although I doubt that as the rest of the results are fine. It is one anomaly which is not too identifiable.
Overall I think my experiment was very good. It only had one very bad anomaly and also did not show much sign of a limiting factor. The other anomaly could have been because of an error with distance measuring or the fact that there was less area of light because of the shade. It was fairly accurate and there were a few other variables that needed to be regarded as important. However, the experiment did go well, I got more or less the same results each of the four times and the average was accurate.
Another way I could do my experiment would be instead, using a light intensity meter to measure the amount of light given to the plant. Also, the bubbles could be collected in a test tube put over the actual beaker. The volume of the bubbles could be measured, and this gives proportion to the size of the bubbles hence giving a more accurate reading of the amount of air.
This way, the experiment is more accurate because of the measuring of the volume of air and also the light intensity instead of distance, so a more accurate graph can be produced.
Sarvinder Saini 10.05