-
50 ml of distilled water, 0 ml of hydrochloric acid (control)
- 45 ml of distilled water, 5 ml of hydrochloric acid
- 40 ml of distilled water, 10 ml of hydrochloric acid
- 35 ml of distilled water, 15 ml of hydrochloric acid
- 30 ml of distilled water, 20 ml of hydrochloric acid
- 25 ml of distilled water, 25 ml of hydrochloric acid
- 20 ml of distilled water, 30 ml of hydrochloric acid
- 15 ml of distilled water, 35 ml of hydrochloric acid
- 10 ml of distilled water, 40 ml of hydrochloric acid
- 5 ml of distilled water, 45 ml of hydrochloric acid
- 0 ml of distilled water, 50 ml of hydrochloric acid
I have chosen this number of readings because it will enable me to see how reliable the results are by drawing a graph, and also because it covers a wide enough range to allow me to make an educated hypothesis. I will take repeat readings in order to verify reliability; it will be necessary to take the repeat readings by repeating the whole experiment again.
I will record the amount of gas given off at 10 second intervals for 3 minutes.
FAIR TEST
There are a number of variables other than just concentration which affect the rate of reaction; for this investigation it is vital to keep these variables constant in order to make it a fair test. The only variable which needs to be changed is concentration.
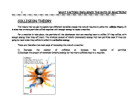
For a chemical reaction to take place, the particles of the reactions must collide, and the collision must have enough energy. The minimum energy that the particles need in order to react is called the activation energy. If the particles have less than this amount of energy, they simply bounce off each other and no reaction takes place. The faster the particles are going, the more energy they have. This is the collision theory. From this we know that the more collisions between particles in a given time, the faster the reaction.
The particles in the liquid are moving continuously, thus allowing for collisions with the metal particles. If the collision has enough energy, a chemical reaction will take place between the two particles. The more collisions, and chemical reactions, that take place in a given time, the higher the rate of reaction.
Variables that affect the rate of reaction are things that affect the amount of collisions in a given time. These include surface area, concentration, and temperature.
Surface Area
As we increase the surface area, we increase the rate of reaction. This is because the only particles which can collide in a reaction, are the particles on the surface of a solid. A larger surface area means that there are more particles exposed, and therefore more collisions can take place per second, increasing the rate of reaction.
In this investigation, the size of the marble chips could affect the rate of reaction and stop it from being a fair test. To prevent this, I will select marble chips all of a similar size to use for the investigation.
Temperature
Temperature also increases the rate of reaction. At low temperatures, particles of the reactants do not have a lot of energy. However, when the substances are hotter, the particles have more energy, which causes them to move faster, and collide more often. The collisions have more energy which means that more of them are successful. In this investigation it will be necessary to keep the temperature constant throughout in order to make it a fair test. I will do this by carrying out the experiments in the same conditions, and not increasing or decreasing the temperature at any point.
Distilled Water
I am using distilled water in order that it is neither acidic nor alkaline, and therefore does not affect the reaction.
SAFETY
This is an experiment involving acid, which can be highly dangerous if it comes in contact with skin or eyes. In order to avoid this, I will wear safety goggles at all times and make sure that my skin does not come in contact with the acid. Any spillages I will clear up immediately.
Prediction
I think that my results will show that the higher the concentration of the acid, the higher the rate of reaction. I will expect the rate of reaction to be highest when the liquid is all acid, undiluted.
I can use the collision theory to explain why I think this. The collision theory says that for a reaction to take place, sufficiently charged collisions must take place between particles, and the more collisions that take place in a given amount of time, the higher the rate of reaction.
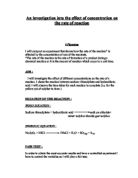
The concentration of the acid is how many acid particles there are in the same volume of water. For example, there are twice as many acid particles in the same volume of water in a 2M solution of acid than in a 1M solution of acid. M = moles, the units that chemical substances are measured in. Moles let you calculate, among other things, masses of atoms, molecules or compounds; the mass of products from reactions; and of course the concentration of a solution. One mole is 602,300 billion, billion molecules or atoms; this is usually written as 6.023 x 10²³ and is called the Avogadro’s number. In this case, I am using hydrochloric acid of a 2M solution, but diluting it with distilled water in order to test the affect that concentration has on rate of reaction.
Concentration
I think that increased concentration will increase rate of reaction because a higher concentration means more acid particles in the same volume of liquid. The acid particles move randomly through the liquid, so more particles means more chance of particles colliding and reacting with particles on the surface of the marble.
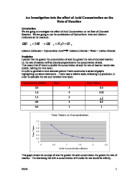
Obtaining Evidence
The way in which I obtained my evidence was safe—primarily, no one was hurt and no equipment was damaged during the course of the experiment. I found that I had chosen a good range, as the readings were easily measurable, and it was possible to create graphs of the results. The readings have been recorded in the tables above. The first shows the entire first set of readings; the volume of gas against the time. The second shows the repeat readings. The following tables show the first, second and average readings for each different concentration of acid consecutively. I have recorded my readings to a good degree of accuracy;. I think that there is enough evidence to allow me to draw a conclusion.
Conclusion
I have plotted a graph for each concentration, of the average of the two readings, of volume of gas collected against time, drawing a line of best fit for each graph. We can see from the graphs that the higher the concentration, the steeper the gradient of the graph; for example, the gradient of the graph for concentration 100% of acid is roughly 0.4, while the gradient of the graph for concentration 40% of acid is approximately 0.3. A steeper graph indicates a higher rate of reaction because this shows that more of the product was being produced over a certain period of time.
From my results and the graphs, I can draw the conclusion that the higher the concentration of acid, the more of the product produced in a given time, and therefore the higher the rate of reaction.
I can explain this, again using the collision theory. A higher concentration means more acid particles in the same volume of liquid, and therefore more chance of collisions taking place between the acid particles and the particles of calcium carbonate on the surface of the marble chips. With more collisions taking place overall, a higher percentage of the collisions will be sufficiently charged so more chemical reactions will take place in a given time.
In this diagram, the grey circles represent acid particles, the blue, water, and the black, calcium carbonate. The arrows show that all the particles are moving. We can see from this that more collisions are likely to happen than if the grey circles were sparse. Also if, say, 50% of all collisions that happen are sufficiently charged for a reaction to take place, in a situation where more collisions are happening, obviously more collisions will result in a chemical reaction.
I predicted that rate of reaction would increase with concentration of acid, and my prediction has been proved correct. However, the results could have fitted my prediction better; the difference in rate could have been more pronounced, and not so slight.
Evaluation
I think my method was fairly good. I can be sure that the results are reliable because I took repeat readings; however, in order to make the results even more reliable I could have taken 2, 3 or even 4 more repeat readings and averaged them out. Also, in order to make the results more reliable I could have continued timing and recording volume of gas until the reactions were fully complete (I would know this because the volume of gas would stop increasing). However, to do this would have taken too much time; also, the gas syringe didn’t have the capacity to complete the reaction, because the most gas it could hold was 100cm3, and many of the concentrations would have produced more gas than this. In order to prevent this I could have used less liquid overall and less marble chips, but this method would have then taken longer.
The graphs show that my results were accurate enough to allow me to draw a conclusion, but could have been more accurate. Most of the points lie fairly close to the line of best fit, but they could have been closer. Although I measured the reactants very accurately, it was difficult to measure the amount of gas produced; the scale on the gas syringe went up by 1, with no markings between each number, so in a lot of cases it was an approximation if the line fell between two numbers.
When I drew a line of best fit for the graphs, particularly the ones where the concentration is lower, I found that the ideal line of best fit (drawn in dashed lines on the lower concentration graphs) did not go through 0,0. This is because the syringe did not start at 0cm3; whenever I put the stopper into the conical flask, this action caused a slight pressure of gas in the syringe and the syringe immediately jumped about 3cm3. This is why in my results tables we can see that with 0% acid, the volume of gas was consistently 3 rather than 0, although no gas was being produced. Another factor which may affect the graphs is the fact that some gas, if very little, was lost between adding the marble chips, and putting in the stopper.
I could have avoided both these things by employing a slightly different method; instead of adding the chips and then putting in the stopper, I could have had the chips in a small test-tube suspended inside the conical flask by a piece of string, with the stopper in, enabling me to start the reaction by pulling the string and tipping the chips out, thus preventing any loss of gas. However, this proved too difficult to do because of the size of the marble chips and the fact that they would have just got lodged in the test tube.
Another aspect which could have caused some of the anomalies is the fact that occasionally the gas syringe got stuck for a while, and then suddenly jumped. There is nothing I could have done to alter this fact, but it was an unfortunate occurrence. It is this occurrence that caused the anomalous results in the reaction where the concentration was 90% acid, circled on the graph.
The surface area of the marble chips could also slightly have affected the rate of reaction, as I mentioned in my plan; however, I made a point of using two similarly-sized chips weighing in total 1g for each experiment, so that the surface area couldn’t change too much from experiment to experiment.
Something else which has to be taken into account is the fact that the gas had to go up the delivery tube to the syringe, against gravity. On the higher concentrations when a lot of gas was being produced this was probably not a problem, but on the lower concentrations, in some cases there may not have been enough pressure to push the gas up the syringe.
I think that I obtained enough evidence in order to allow me to draw a conclusion, because I took my readings over a large range. I also took the readings very close together, every 10 seconds. The fact that I used such a large range, and did so many experiments means that any anomalous results aren’t of such consequence, because there are always other results very close in time or concentration to these.
FURTHER INVESTIGATIONS
There are many ways in which I could extend this sort of investigation, for example I could investigate how surface area or temperature effect this same experiment; e.g. keeping the concentration the same but using different sizes of marble chips, or heating the experiment etc. Other reactions I could investigate include the reaction between sodium thiosulphate solution and dilute hydrochloric acid (HCl + sodium thiosulphate → sodium chloride + sulphur dioxide + sulphur + water), or the decomposition of hydrogen peroxide solution (hydrogen peroxide → oxygen + water). Using either of these reactions, particularly the second, I could also investigate the effect that a catalyst has on the rate of reaction.
BIBLIOGRAPHY
Chemistry For You – Lawrie Ryan
Co-ordinated Science: Chemistry – RoseMarie Gallager, Paul Ingram
The Usborne Internet-Linked Science Encyclopaedia
The Internet (www.gcsechemistry.com )