Or
NA2 S2 O3 (AQ) + 2HCL(AQ) 2NACL (AQ) + S(S) + H2O + SO2
Apparatus
I will use…
-
A boiling tube – to hold the solution
-
Paper with a cross on it – So that I can tell when the reaction has happened
-
A measuring Cylinder- To measure the volume of thio, water and acid.
-
A stop clock – To measure how long the reaction will take.
-
A thermometer – To make sure the temperature stays constant.
Diagram
Method
First I will measure out 5cm3 of acid. I will do this 6 times and I will add the following amounts of thiosulphate and water each time…
I will then wait for the solution to go cloudy enough not to be able to see the cross through the bottom. The temperature will stay constant right the way through the experiment to make the experiment a fair test. (Only one variable changes at one time) Also I will keep the amount of acid the same, I will use the same cross and I will repeat the experiment at least three times. During the experiment, I wont use a catalyst and I am using solutions so particle size wont matter. The total volume of the solution will stay the same at all times.
Results Table
Analysis
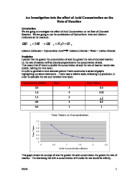
I have got three sets of results so I have decided to add another column onto my table of results and to average them so that the information is fairer and more accurate but also to make the information easier to handle.
I think that line graphs are a better source of information than a bar chart so I am going to produce one with a line of best fit.
I have produced the graph and it shows that as the volume of thiosulphate decreases the rate of reaction decreases but not in a simple relationship as it is not a straight-line graph. It seems to be a hyperbola, which suggests an inverse relationship. I will plot a 1/time graph to see if it produces a straight line, which would confirm this.
My first graph does agree with my prediction as it proves that the higher the concentration the faster the reaction takes place. The reason, as I said in my prediction is collision theory. The more concentrated the solution the more molecules it has which means there is more chance of a collision and therefore a reaction.
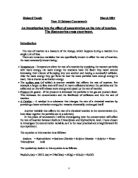
I have produced this graph and it proves that the concentration of thio is directly proportional to the reciprocal (1/t) of time taken.
It is much easier to see the relationship between the thio and the variables plotted on a straight line graph than on a hyperbola.
Evaluation
My experiment worked quite well I think. I had one anomaly, which I have highlighted on both of my graphs. This was probably due to my measuring out not being accurate enough. I think to make it more accurate maybe I could have used a Burette. I got three sets of results; my experiment probably would have been more accurate if I had collected more results.