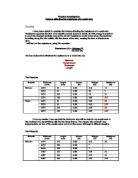
Length is the best variable because this variable is the easiest to measure compared with measuring temperature, area or material.
Length of wire to use:
1 metre of metal wire should be used because this is the same distance of an average arms length. Also we can get 10 readings of results from a 1metre length of metal wire if each reading is taking every 10cm.
Materials to consider fro use in this experiment:
Steel would melt too easily in this experiment, as the resistance would be to high for a 1metre length of steel so therefore steel can’t be used. Copper wouldn’t resist in a 1metre length because in this experiment in order to get any results hundreds of miles of copper would have to be used so therefore constantan has to be used.
Number of batteries to use to get suitable current of:
- Minimum – on the scale
- Maximum – 1 amp
I found that 1 battery was sufficient and produced suitable readings for the experiment. It is important that readings are on the scale because if they are not it will be problem in the experiment.
I am going to investigate how the length of the wire affects the resistance of the wire.
Plan
- The apparatus will be collected as follows:
Metre rule
Several wires
1 battery (1.5v)
1 voltmeter
1 ammeter
2 crocodile clips
1 metre of constantan
- The apparatus will be set up as shown in diagram
X X
- The 1 of constantan will be taped across the metre rule and connected to the crocodile clips.
- Place the crocodile clips at appropriate place.
- Turn on the power supply.
- The voltage and current will then be read.
- Then immediately the power supply will be turned off to avoid burning of the wire.
- Repeat, only increasing the gap between the crocodile clips by 10 cm until you reach 100cm.
- The whole experiment will be repeated two more times in order to gain an accurate average.
Fair testing
To make the experiment a fair test the following points will be considered:
- The same material will be used each time
- The same length of wire will be used each time
- The same person will move the crocodile clip along the wire each time.
- The voltage will remain the same for the whole experiment
- The experiment will be done three times in order to gain a suitable range of reliable results.
Safety
- Normal lab rules apply (hair tied back, ties tucked in etc…)
- Is there a danger of the metal wire being to hot?
The wire being to hot be a minor worry.
Prediction
Ohm’s Law
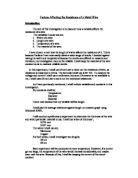
It is also relevant to know of Ohm’s Law, which states that the current through a metallic conductor (e.g. wire) at a constant temperature is proportional to the potential difference (voltage). Therefore V ¸ I is constant. This means that the resistance of a metallic conductor is constant providing that the temperature also remains constant. Furthermore, the resistance of a metal increases as its temperature increases. This is because at higher temperatures, the particles of the conductor are moving around more quickly, thus increasing the likelihood of collisions with the free electrons. The same applies to its length, area and its material.
Using Ohm’s Law I can predict that the longer the wire, the greater the resistance will be. I also predict that if we double the length of the wire, the resistance will also double. This is because the longer the wire the more the free electrons are going to collide with the other free electrons and also the metal particles therefore more heat is going to be lost in these collisions. This is the same for when we double the wire so the resistance will be doubled, as there are double the collisions.
resistance
R=I/V
0 Length of wire (cm)
Obtaining information
Method
- The following apparatus was used in this experiment:
Metre rule
Several wires
1 battery (1.5v)
1 voltmeter
1 ammeter
2 crocodile clips
1 metre of constantan
- The apparatus was then set up as follows:
X X
- The 1 metre length of constantan was taped across the metre rule taught.
- One crocodile clip was placed at 0cm on the wire and the other crocodile clip was clipped at 10cm on the wire.
- The power supply was turned on by connecting the battery to the rest of the circuit
- The voltage and current was then read of the voltmeter and ammeter.
- Then immediately the power supply was turned off to avoid any burning of the wire.
- This method was repeated but with the distance between the two crocodile clips on the wire increasing by 10cm each time until the length reached 100cm.
- This whole experiment was repeated two more times in order to gain an accurate average.
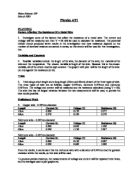
Results Table
I have plotted the results on a graph.
Analysing Information
Conclusion
The results show that as the length increases, so does the resistance. The graph shows a steady increase. E.g. the resistance for a length of wire which is 10cm is 2.04Ω, which increases to 9.14Ω at a length of 50cm and finally to 19.1Ω at a length of 100cm. This agrees with my prediction that as the length of a wire increases so does the resistance.
The longer the piece of wire, the more resistance it will have. This is because there are more free electrons to carry charge; therefore the flow would be taking longer and slower.
I also predicted that the length was proportional to the resistance i.e. when the length doubles, the resistance doubled. This part of the prediction was not correct. When the length was 50cm, the resistance was 9.14Ω. If the 50cm is doubled, we have 100cm; the resistance for a piece of wire 100cm in length is 19.14Ω. This is a little more than double 9.14Ω. This proves my theory that as the length doubles so does the resistance, is incorrect.
I also notice this is incorrect due to the graph. The line of best fit doesn’t pass through (0,0). This means that the results will not be proportional as the x and y-axis will be increasing at different rates from different starting points.
Evaluating Information
Evaluation
I thought the investigation was fairly straightforward and easy to carry out. It was important to measure exactly the right length when adjusting the crocodile clips onto the resistance wire. This proved slightly difficult as the wire often had kinks and curls in it so it was difficult to straighten completely. We overcame this by pulling the wire really tight. It was also important to switch the power supply off as soon as you have your reading, otherwise the wire would get hot, melt and produce a smell. The first test we carried out, we failed to consider this and therefore had a smouldering wire. We soon learnt to turn our power supply off immediately and had no problems from then on.
We did the experiment thrice to ensure accurate results. It might have been more reliable to do the experiment 4 or more times to produce even more reliable data. Nonetheless, the results look accurate and correspond with each other and show a trend. The repeat readings were almost identical to the first ones. The averaged results were all close to the line of best fit on the graph; there were no anomalous results.
Overall, I feel that the evidence I have produced is sufficient to support a firm conclusion.
Physics
Invetigation into the factors affecting the resistance of a metal wire
Steven Anderson